You can use multiple graphs and tables in your report, depending on what best illustrates a given dataset. This leads to the next improvement – report customization.
Customize your reports
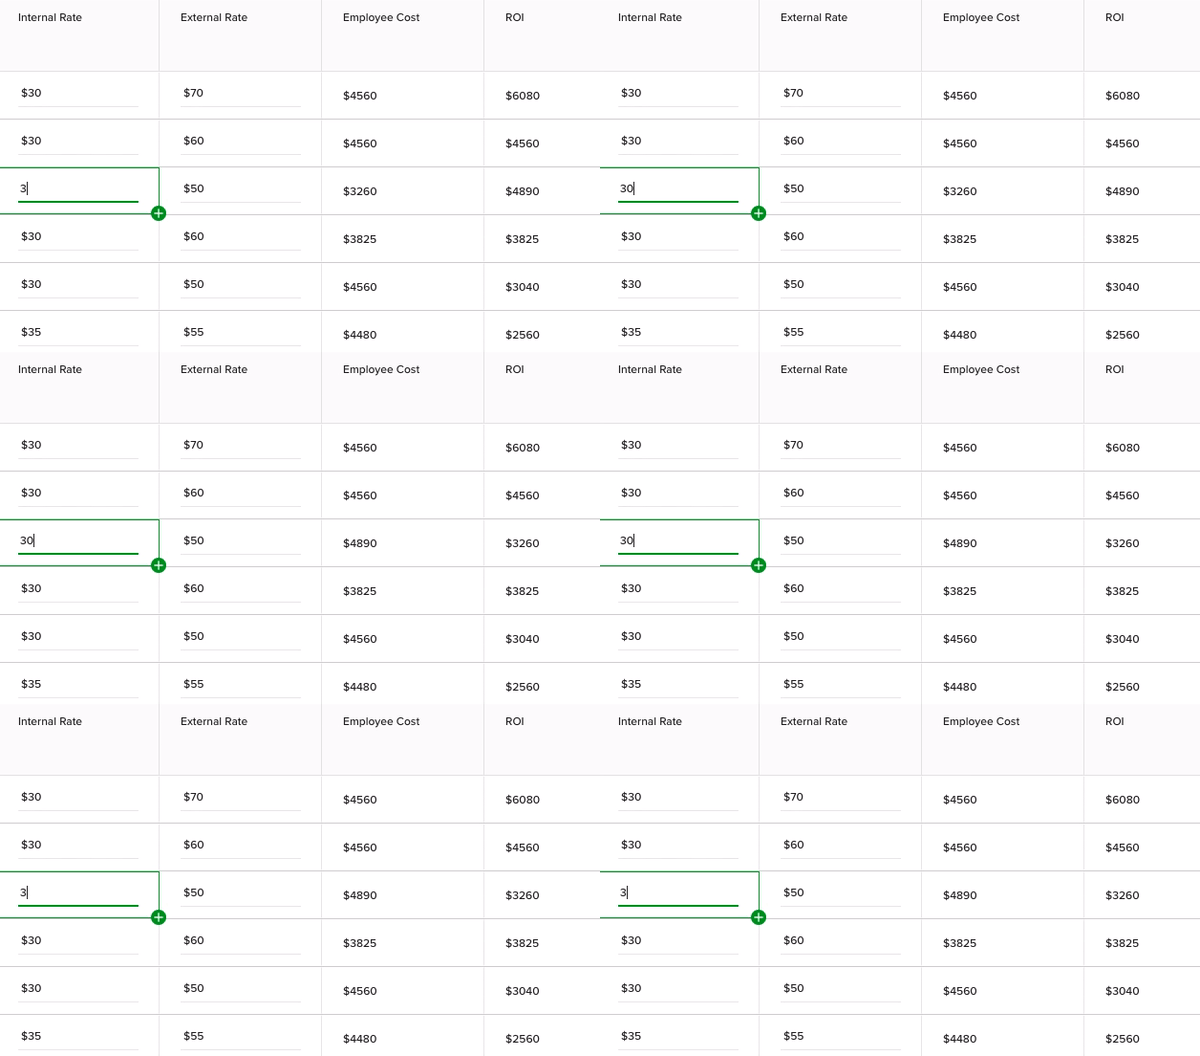
We want teamdeck to fully answer your needs, that’s why we made the reports customizable. You can combine tables and charts to make your report more specific and relevant to what you want to analyze.
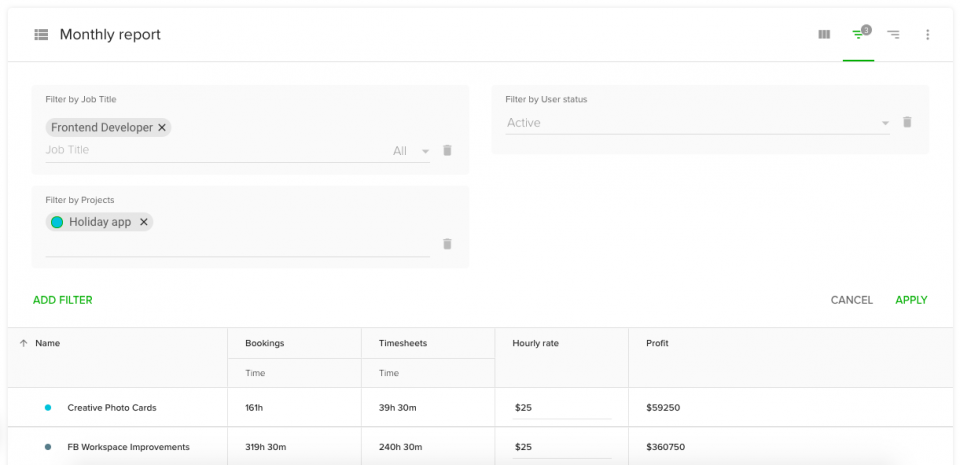
Compare bookings, timesheets, vacations and availability. Pick the metrics and hit apply to analyze only what’s the most important for you at the moment.
Now, to drill down your data even more, group it by projects, people and date range to compare different data sets. This way you can evaluate specific projects or people. Is your report still too broad? Add filters like job title, project’s name, vacations reason or tags.


