Home » Blog » Project Manager’s Guide to Project Status Report
Being in charge of a project, you need to communicate its status to your clients and project stakeholders regularly. Of course, you also want to keep track of the progress yourself: it’s hard to even talk about effective project resource management without monitoring the people’s performance and measuring KPIs.
What our readers get to know thanks to this article:
As for the KPIs themselves, you likely want to make sure that your project will be done on time, within budget, and with no unnecessary strain on the team members. Consequently, you probably want to monitor the time (and money) logged by your employees, keep track of the overtime, and analyze how the actual progress compares with your project estimates.
To keep all of the stakeholders in the loop about project health, you need to communicate with them regularly. An efficient way to do so is to send out weekly status reports that include main updates about the project.
In this article, we’ll show you how to build a project status report from scratch using Teamdeck, a complete SaaS resource management software.
What is a project status report?
In short, a status report is a regular update sent from a PM to the project’s stakeholders. It should contain high-level information about the project: recent progress, upcoming plans, as well as risks, and issues.
As you can see, a project status report seems to be a very straightforward thing. To understand it fully, however, we’re going to dive a little bit deeper into the goals of this report, its benefits, and core elements—all for you to be able to create your project status reports with confidence.
The goal of regular project status reports
The main reason you create your monthly or weekly project status reports is to inform stakeholders (both internal and external) about what’s going on in the project: the progress you’ve made, milestones you’ve achieved, issues or risks you might be facing. As such, a good status report will save you quite a lot of time—your manager or the client won’t need to ask additional questions or organize status meetings (which, by the way, are not very effective).
At the same time, it’s a good opportunity for you to take a look at the big picture. Very often, project managers are so occupied by the daily work and going from one task to another, that they forget to think about the strategy or the high-level overview of their project. As a result, they might be failing to notice emerging patterns or improvement areas.
A status report is an effective means of communication between the PM and the stakeholders (clients, internal managers). Unfortunately, it can sometimes be misinterpreted and turned into something that doesn’t fulfill the goals outlined above. We feel that it is important to remind you what a status report is not.
What a project status report is not
First of all, your status report shouldn’t be a project diary: a detailed account of everything going on since your last update. It’s not necessary to describe what every teammate did and didn’t do, unless, of course, it’s something you consider very important. Let’s play out a scenario here:
Say that someone’s poor performance is, in your opinion, putting the project at risk. Should you mention that in your status report? In essence, yes—you can mention that since it’s a potential roadblock. What’s important, however, is that you should make an action plan first: schedule a meeting with that employee, consider replacement options, and assess how a potential personnel change could affect the project timeline. Try to get to the bottom of things, and then report on the effects of your action: the status report is not a place to complain about your teammates, focus on the two P: progress and plans.
While reporting is a big part of project management, it shouldn’t be your primary focus. If your stakeholders demand reports so detailed and frequent that you feel you don’t have time to do your job, it’s time to discuss that with your manager. Project status reports should be brief, informative, and created in a project management template without slowing down the PM’s work.
Core elements of project status report
You need to assume that the stakeholders you’re sending your status reports to receive many different updates during their workweek. This is why you should start your project report with data that allows them to grasp what this document is about quickly. Remember to include at least the project name and your name.
A good idea is to add an element that will summarize project health and potentially alert stakeholders that a given report is critically important. It could be a color-coded project status update that will set the tone for the entire report. A red “off track” sign will immediately notify your stakeholders that something is not well, whereas a green “on track” message will let them know everything is fine.
It’s now time to summarize the progress done by your team. You should mention the milestones achieved since your last status report. Keep in mind: it’s not about listing every single task completed and bug fixed. Instead, try to give a general idea of what’s been done recently.
In the next part of the project status report, you can talk about your plan for the next week/sprint (depending on how often you send your report). Again, try to write on a milestone level, not the task level, but not be too generic. A “we will work on improving the app” kind of message will not fly.
Next, you may outline any potential risks and issues you’ve encountered. As mentioned previously, try to include possible solutions and workarounds. If you need any help from stakeholders, you can also remind them about it in the project status report. Say that you want to start working on the mobile version of your client’s e-commerce in 3 weeks. In order to start working, however, you need to receive mobile-friendly product images from the client. While this is not a plan that will be covered in the next week/sprint, you should still mention that in advance, preferably towards the end of your status report, as an action point for your client.
How often should you send project status reports?
Arguably, the most common cadence of sending project status reports is every week. Such weekly project reports shouldn’t be too long or too detailed, but they will give everyone involved a sense of control.
If you and your teammates are working in sprints that last two weeks, you can send a single status report each sprint.
How to create a project status report?
You can use an ordinary text document to create your project status report. Some companies encourage their employees to write and share status reports on Slack or Skype. All of these options are viable for submitting your written summaries of the project or any milestones you want to describe. What you might want to consider, however, is to add interactive charts to your project status report. Why? Data visualizations will make it easier for stakeholders to understand the status of your project. A burndown/burnup chart will provide them with a better sense of where the project’s at than your written description.
In this blog post, we will encourage you to enrich your status report with data that’s already available in the apps you use with your teammates. What kind of apps are we talking about?
- Project Management Software: many PM tools enable you to export crucial charts about your project’s status: e.g., Gantt charts or tasks burndown. On top of that, some project management software would allow you to send status reports directly from the app.
- Resource Management Software: similarly to project management-focused tools, RM apps can have useful reporting features. Using data from your team’s resource calendar, you’d be able to generate charts that give a good overview of the team and project health.
A huge advantage of status reports that you can generate in the apps you use to manage your employee’s work is that once you configure such a report, it’s always there. You don’t need to prepare it from scratch every time you want to send a weekly status report—you have all of the data in one place. Auto-updating status reports are also handy when one of your stakeholders asks you to send it outside of your reporting schedule: no problem, you have it ready at all times.
Let’s see how you can create a project status report using a resource management app, Teamdeck.
How to build project status reports with Teamdeck?
Teamdeck is a resource management software used by creative agencies, innovative IT teams, and industry-disrupting startups. We’ve already mentioned that your company’s resource and project management tools are the best sources from which to get data about your ongoing projects, and Teamdeck is no exception. Its reporting suite allows you to build auto-updating project reports based on your team’s schedule and their timesheets.
You can share these reports with people from your company as well as the outside stakeholders. Add a link to the Teamdeck-generated report to your project status report document, so that project stakeholders can see how the situation is progressing. Check out an example status report under this link—in a moment, you will learn how to build a similar one.
The project we’ll show you how to build will include:
- An overview of time logged by the team members, as well as the comparison with initial estimates (bookings).
- A summary of how much money has been logged by each team member (based on their timesheets and hourly rate).
- Time logged per role.
- Time logged by different departments.
- An overtime report.
- Project burnup tracker.
Let’s dive in!
Start your free Teamdeck account
In order to build your project status report with Teamdeck, you need to create an account in the app—you’ll have 14 days to explore this tool for free. Onboarding your team will be simple: you can import their data into the app together with a list of projects your company is working on. You can also schedule a consultation with Teamdeck’s customer success specialists: we can help you get started with data-driven resource management.
When you log in to your Teamdeck account, you can find the reporting section in the top menu of the app. From its dashboard, you can either select a report template to use as the basis of your report or build one on your own.
Today, we’ll be creating a project status report from scratch, so click on the create custom option.
Once your new, empty report opens, remember to name it (use your project name to be able to find it easily later) and provide the appropriate date range.
Note: you can manipulate the date range even after your report is set up. The data will change to reflect the time period you’ve chosen. This way, you can always go back and check the results from a past period of time.
Track estimates vs. actuals
The first element of our project status report will be a bar chart visualizing the estimated hours (bookings) vs. the actual hours logged by your team in their timesheets. You shouldn’t feel bad if there’s some difference between project estimates and actuals. That’s completely normal—project estimates are rarely spot-on. Analyzing this chart, however, gives you an opportunity to see whether the change between estimates and actuals is steady, or perhaps there is a moment in the project when the actuals significantly overhauled your plans. Compare this with your project’s timeline: the chances are that you can identify a part of the project or even a particular task that is to blame here. A lesson for you? Next time you’re estimating a similar project, you’ll know to create a bigger buffer for that risky part of its delivery.
[/vc_column_text]
Here we can see that, even though the team was always putting in more work than planned, it was not until January 17th that this difference was significant. As a project manager, you can easily track the workload for that day and see which tasks were responsible for such an amount of additional work.
Calculate the amount of money logged by your team members
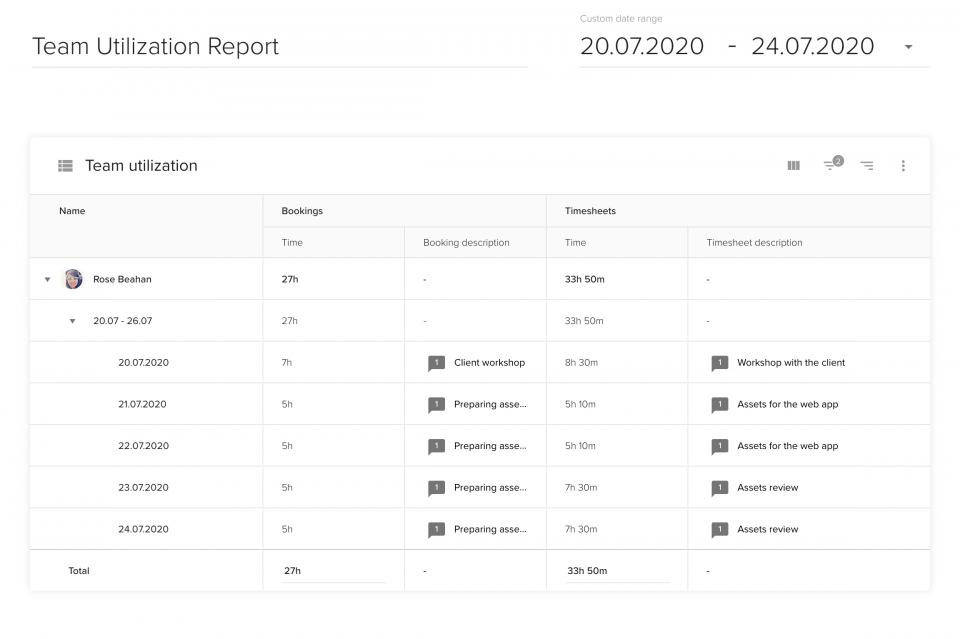
The table created in this step will be especially helpful for people that need to calculate employee payroll or analyze how much money was logged by every team member. This is also an indispensable element of a time & material-based project status report. You can add different types of data visualization into your report by clicking on the plus icon in the lower right corner of your screen. In this case, you need to select the table. Once you can see it in your report, it’s time to edit it. Delete the columns you don’t need (leave only the Timesheets column), filter the whole table to show only the data from the project you need to provide a report on.
Now it’s time to add custom columns to your report—there are two types of custom columns:
- a custom value column, which acts like a spreadsheet column: it’s empty, and you can type any value into it by hand. These values are saved together with your report, so you can see them (or update them) every time you browse the report. Here, we’ve chosen to create a custom value column called hourly rate and to fill it out manually with our employees’ rates. You can pick a data format that best suits the value you’re about to enter: in this case, we went with currency expressed in dollars.
- a custom calculation column. You have to provide a calculation formula here: this field will be used to display data. In this report, we’ve added a “Money logged” calculation. The formula is as follows: (Timesheets: Time/60)*Hourly Rate. You might be wondering why we have to divide the timesheets by 60. The answer is fairly simple: Teamdeck is storing the timesheets data as minutes. Even though you see 1h 20 min in the timesheets column, the system is storing it as 80 min. Here, however, we need to have the data recorded as hours because we want to multiply them by people’s hourly rates—hence why we’re dividing the timesheets value by 60 first.
This table shows you how much work every team member has put into your project and how much money you should bill your client for your team’s work.
You can also dig deeper into your employees’ own descriptions of their tasks. Do that by adding a column called “Booking description” or “Timesheet description” to your table. This way you’ll be able to tell with more certainty what caused certain trends in your team’s timesheets.
[/vc_column][/vc_row]
Create a breakdown of timesheets per different roles in your project team
You might want to dig deeper into your data and, for example, break your team’s timesheets into different roles. A pie chart will be great to visualize the proportion of different roles’ workloads.
We can see that, out of our team’s 141 logged hours, the UX Designer has recorded 44 %. Now, why would that be important for us? First, it can be an indication of the project’s current status. UX Designers usually work on the project in the early stages of its production. Imagine that you had a similar proportion of workload towards the end of the project. Then, it could mean that the UX Designer is fixing some UX issues, perhaps the ones that they uncovered during usability tests with the users.
It’s a good moment to let you know how Teamdeck knows what the job titles of different people working on your project are. This kind of information needs to be provided by you: you can create the so-called custom fields and add them to both people and projects in Teamdeck. The most popular project-focused custom field is “Client”. When it comes to people, their custom fields usually include “Job Title”, “Office location”, “Seniority”, “Department”.
Adding custom fields to your teammates and projects has two major benefits:
- You can filter your resource calendar and only display people/projects that fulfill specific criteria. Say that you’re trying to assemble a group that can work on an upcoming project. You’re looking for experienced software developers, ideally based in the US, because that’s where the client is. Just looking at the list of names, it would be difficult to find suitable people, especially if your talent pool is large. Using custom fields, you can quickly identify people that match the requirements.
- You can use these custom fields as additional criteria in reporting. When working on a project status report, you might want to include a breakdown of costs logged by different departments. With custom fields, you can easily group data by categories you define. An example of that was the chart showing the distribution of tracked time among different roles. Now, we’ll take a look at a similar use case.
Check how much time different departments have logged
Just like you can analyze the timesheets broken down into particular job titles, you can also check which teams have logged time within your project. Create the same pie chart as you did in the previous step, but instead of grouping the data by “Job titles” choose “Departments” or “Teams” (depending on what kind of custom fields you have in your organization).
Why would you want to drill data down into departments rather than job titles? It’s useful when you don’t want to do an in-depth analysis but rather see how much time was spent by different teams involved in the project (design, marketing, programmers).
In the image, you can see that the majority of the time spent on the project so far has been logged by the production team. If that’s an expected situation at this point, it is additional proof that your project is on the right track.
Calculate the overtime
Many project managers would say that some overtime is inevitable, and even if you subscribe to this point of view, you should still keep track of who’s putting in extra hours. Depending on the resource management software you use, there might be different options for calculating or distinguishing overtime. With Teamdeck, “overtime” is one of the default timesheet tags that your team members can use when logging their time. As a result, your project reports can also display data based on that tag.
Let’s create another pie chart and choose the Approved overtime timesheet tag as a metric to break our data into. Right off the bat, you can see that this team has logged over 67 hours of overtime in the selected time period.
Looking at a table to the right, you can see how much overtime was recorded by each person working on that project. If you go to this chart’s settings and change the format from time to percentage, you will be able to see a percentage summary of this team’s overtime. In our case, Brett Konopelski has logged 91% of this project team’s whole overtime. Perhaps he has too much on his plate?
Track your project’s progress with a burnup tracker
As a project manager, you’re probably more used to seeing burndown trackers in project status reports. A burnup chart, as the name suggests, shows how particular values went up over time. In our case, we’re focusing on the estimated hours (bookings – dark green) and the actual time logged in (timesheets – bright green).
From the start of the period in question, our team has been logging more time than it had been planned. The gap between estimated and actuals grew around the middle of the month. Such a summary makes it easier to spot the exact moment when your project started to generate way more working hours than expected.
Are you ready to start building your own project status reports?
Creating informative project status reports is an important element of effective project management. Status reports help you to save time: you don’t have to introduce the insights regarding your project to your higher-ups—the data is available for them to see and analyze. On top of that, a summary of the project’s progress enables you to make better decisions regarding the optimization of your project management efforts. Are you seeing a spike in overtime hours? Perhaps it’s time to balance the workload of your team or negotiate the timeline.
We hope that this project reporting guide will be helpful in your job as a project manager or a project team leader. Use it to keep track of your team’s performance or to communicate the progress to the higher-ups. If you use Teamdeck to build it, you can easily share your project report with your client or managers.
Do you want to have more help building your own project report with Teamdeck? Schedule a call with Aniela. Our expert will help you create a project report template that works best for your team and your project.
You may also want to check other project reporting guides we’ve published: