

Customize your reports
Choose metrics, filter and group the data, and adjust chart settings to get the numbers you need.
On this page
Every table and chart in a report has its own buttons for metrics, filters, grouping and settings. Use them to show exactly the data you want to analyze, for example only active people or only billable projects.
Before you start
- Open a report you created or one that you can edit. See Create, save and share reports.
- People with the Regular role can build reports about their own data only.
Choose metrics
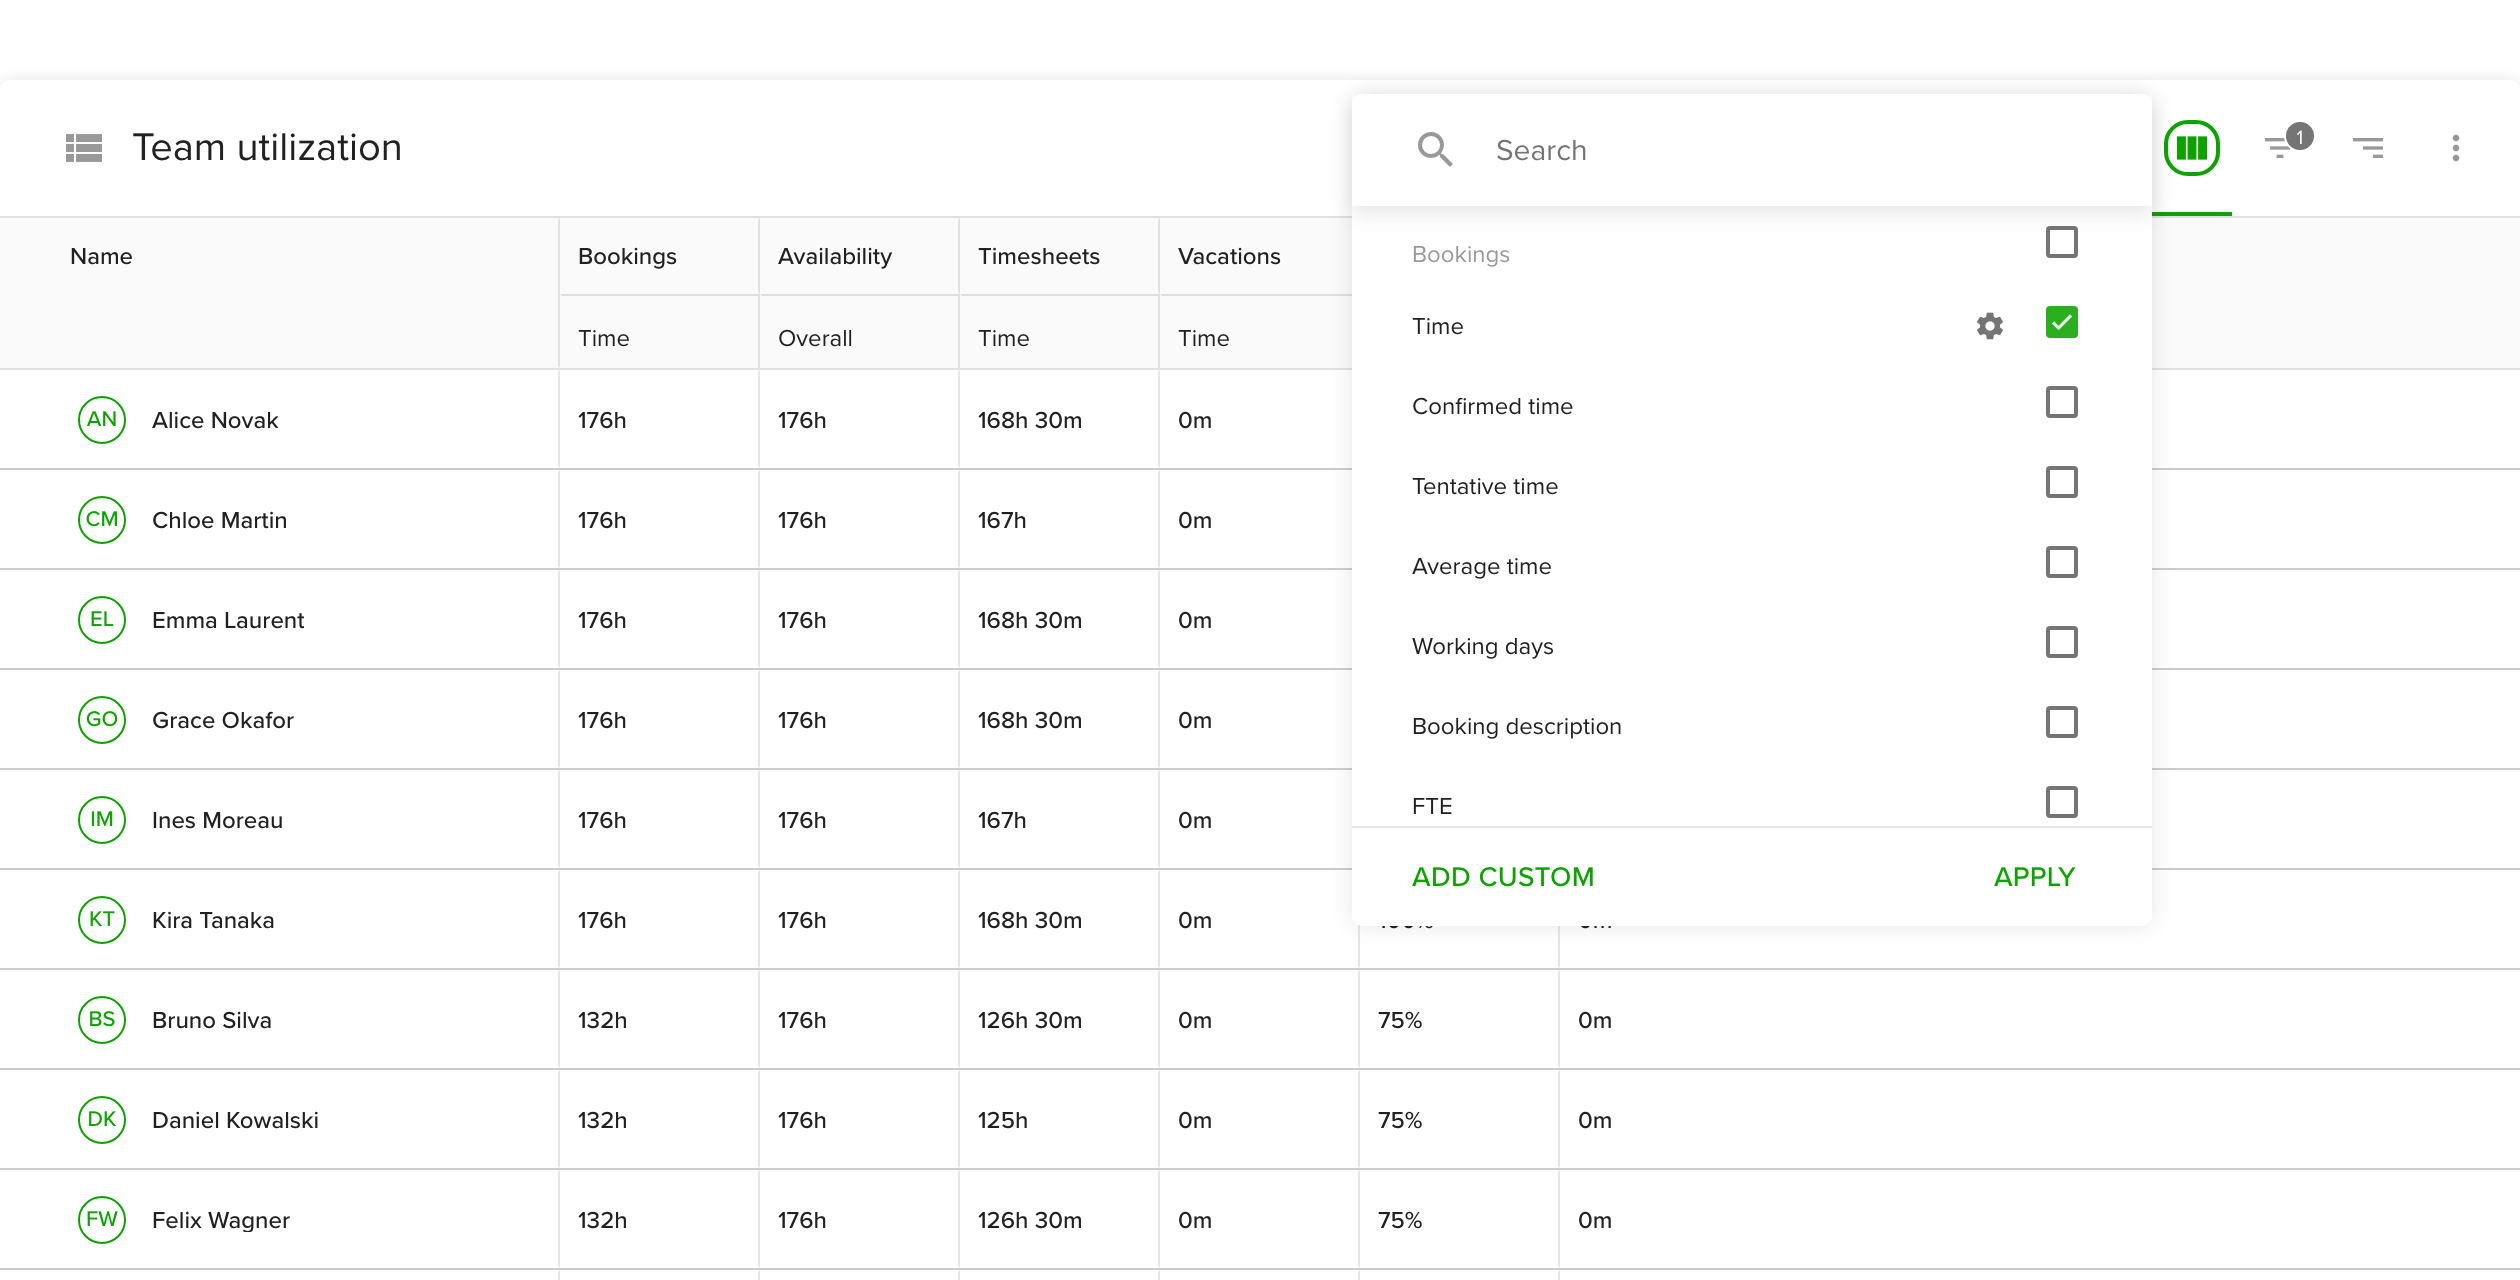
Metrics are the columns of a table or the data series of a chart. They are available for tables, line charts and bar charts.
- Click the columns icon in the top right of the table or chart.
- Tick the metrics you want. They are grouped as Bookings, Timesheets, Availability, Holidays, Vacations, People, custom formulas, custom fields and tags. Use Search to find one quickly.
- Click Apply.
Add your own values and calculations
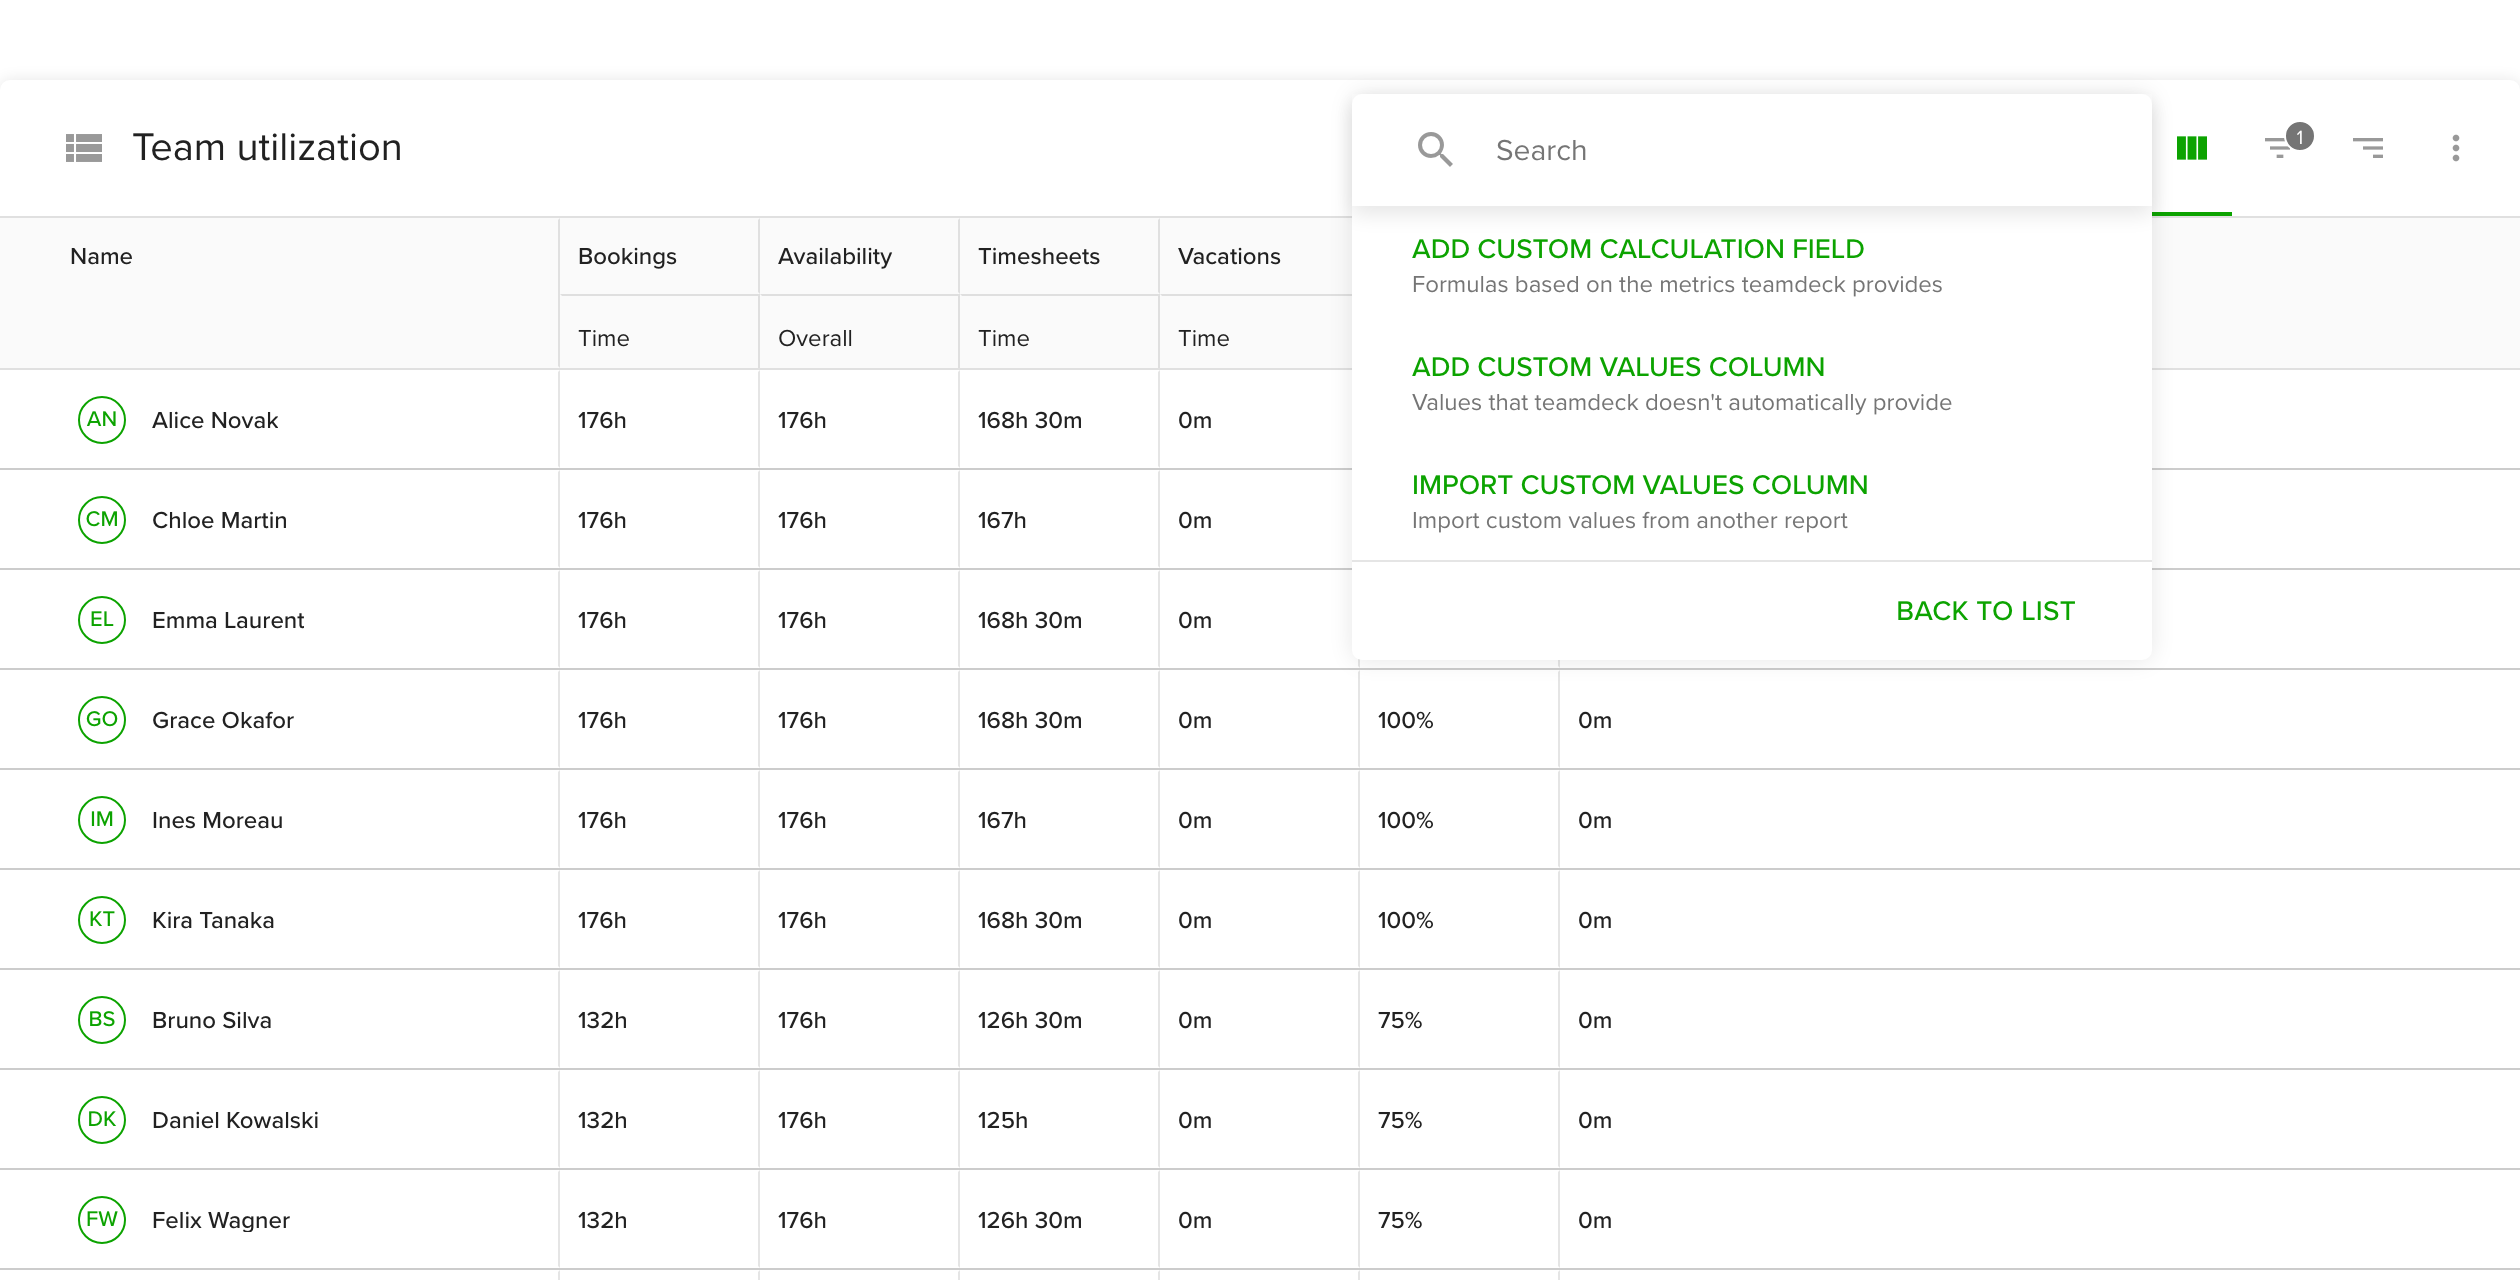
Click Add custom at the bottom of the metrics menu to pick one of three options:
- Add custom calculation field builds a formula from other metrics, for example profit as hourly rate times tracked hours. Give it a name, pick a data format (such as a currency) and write the formula. See Use functions to create custom calculations.
- Add custom values column adds a column for numbers or text that Teamdeck does not have, such as an hourly rate. Name it and pick the data format. The column starts empty, and you type a value for each row. You can use it in formulas unless its format is text.
- Import custom values column copies a column, with the metrics it depends on, from another report. Managers and Owners can import from organization, own and shared reports. People with the Regular role can import only from reports they created.
Custom values must be entered in a table first. After that you can show them in line and bar charts too.
Filter the data
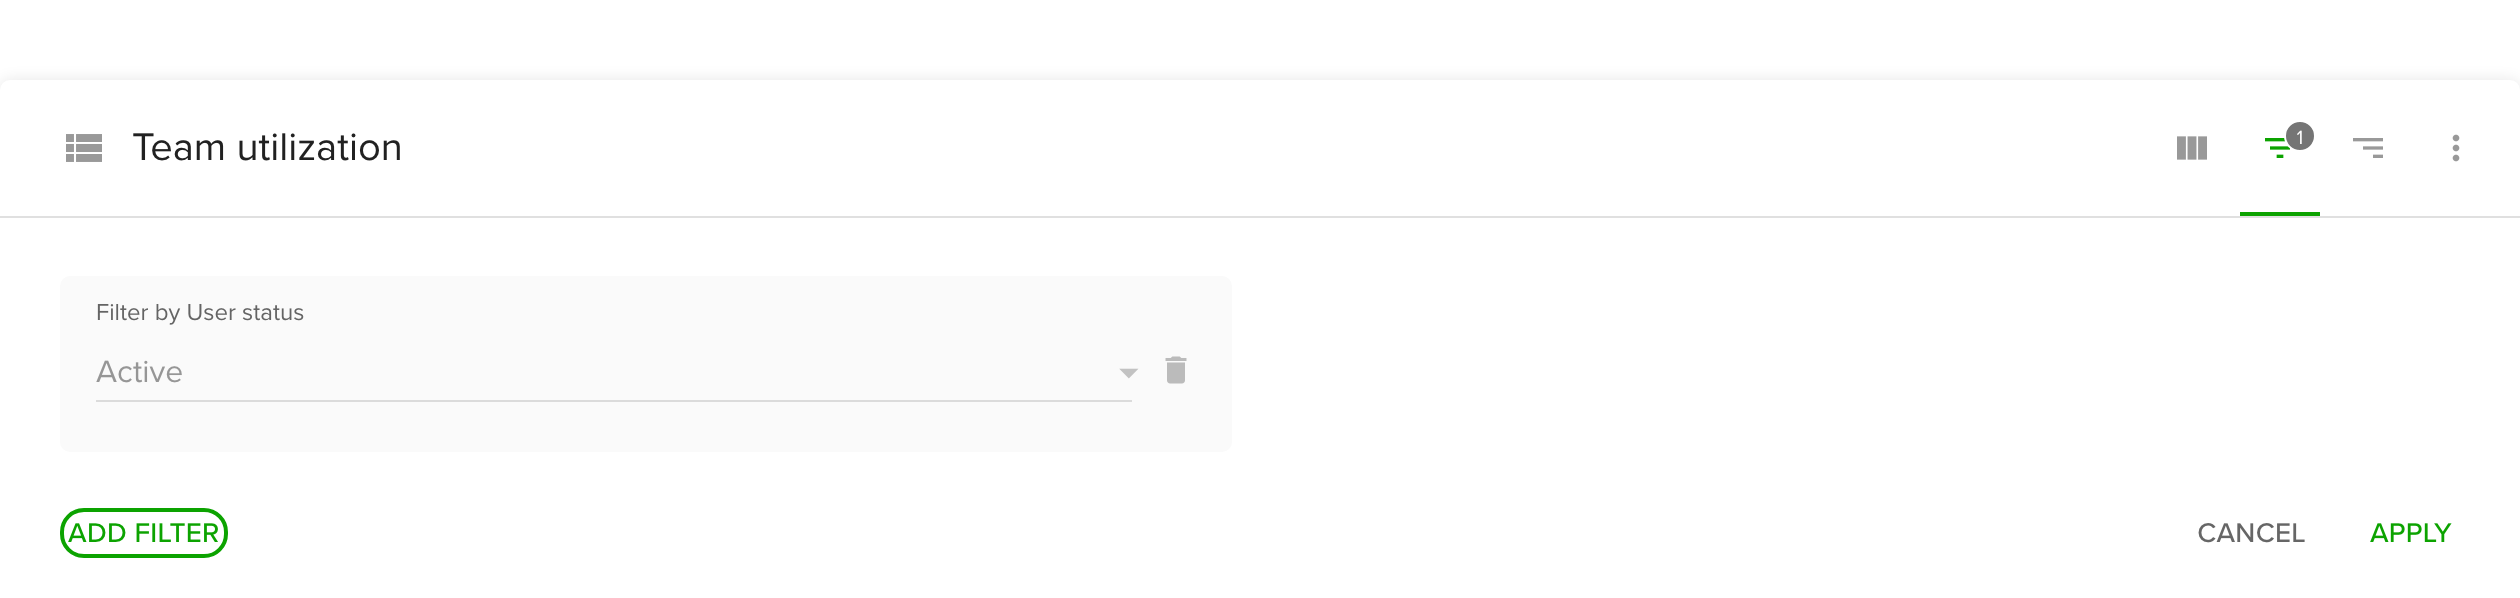
Filters narrow the data. They are available for tables and all chart types.
- Click the filter icon.
- Click Add filter and tick what to filter by, for example projects, people, tags or a custom field such as department.
- Pick or type the values you want to keep.
- Click Apply.
Remove a filter with the trash icon next to it. Booking tags let you separate billable from non-billable hours.
Group the data in a table
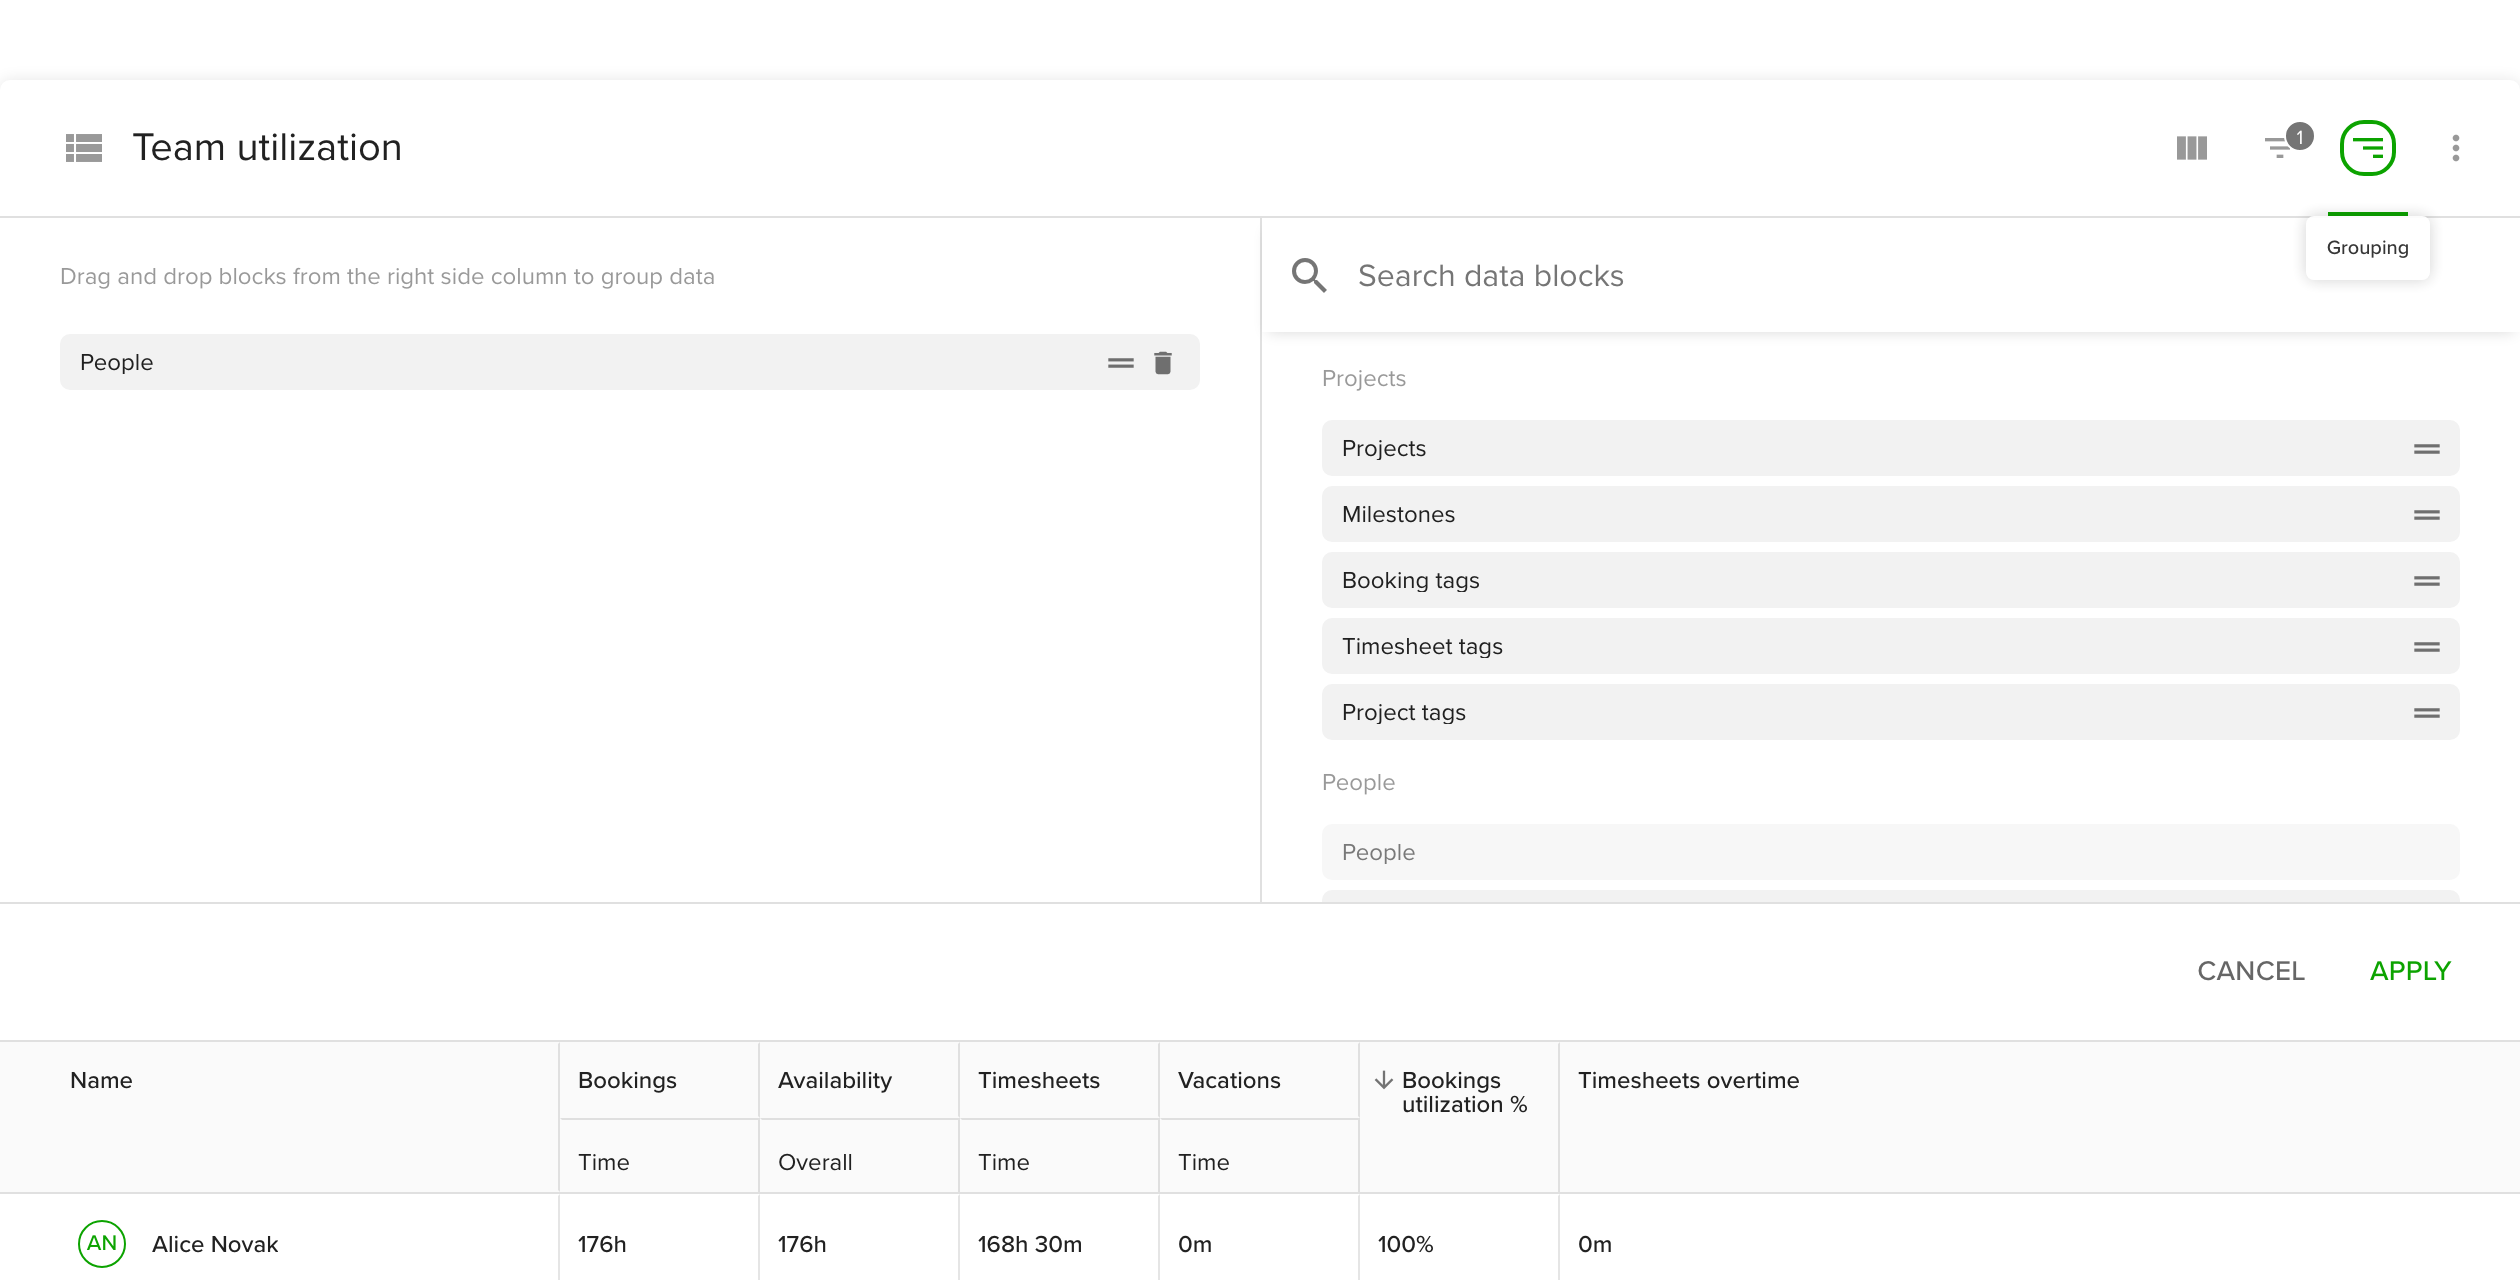
Grouping decides how table rows are organized, for example projects with people under each project.
- Click the grouping icon.
- Drag blocks such as Projects, Milestones, Booking tags, People, Organizational units or a date range (Years, Months, Weeks, Days) from the right column into your structure on the left.
- Drag blocks up or down to change the order.
- Click Apply.
Change chart settings
Line, bar and pie charts have a gear icon for settings. Click Apply after each change.
Line chart
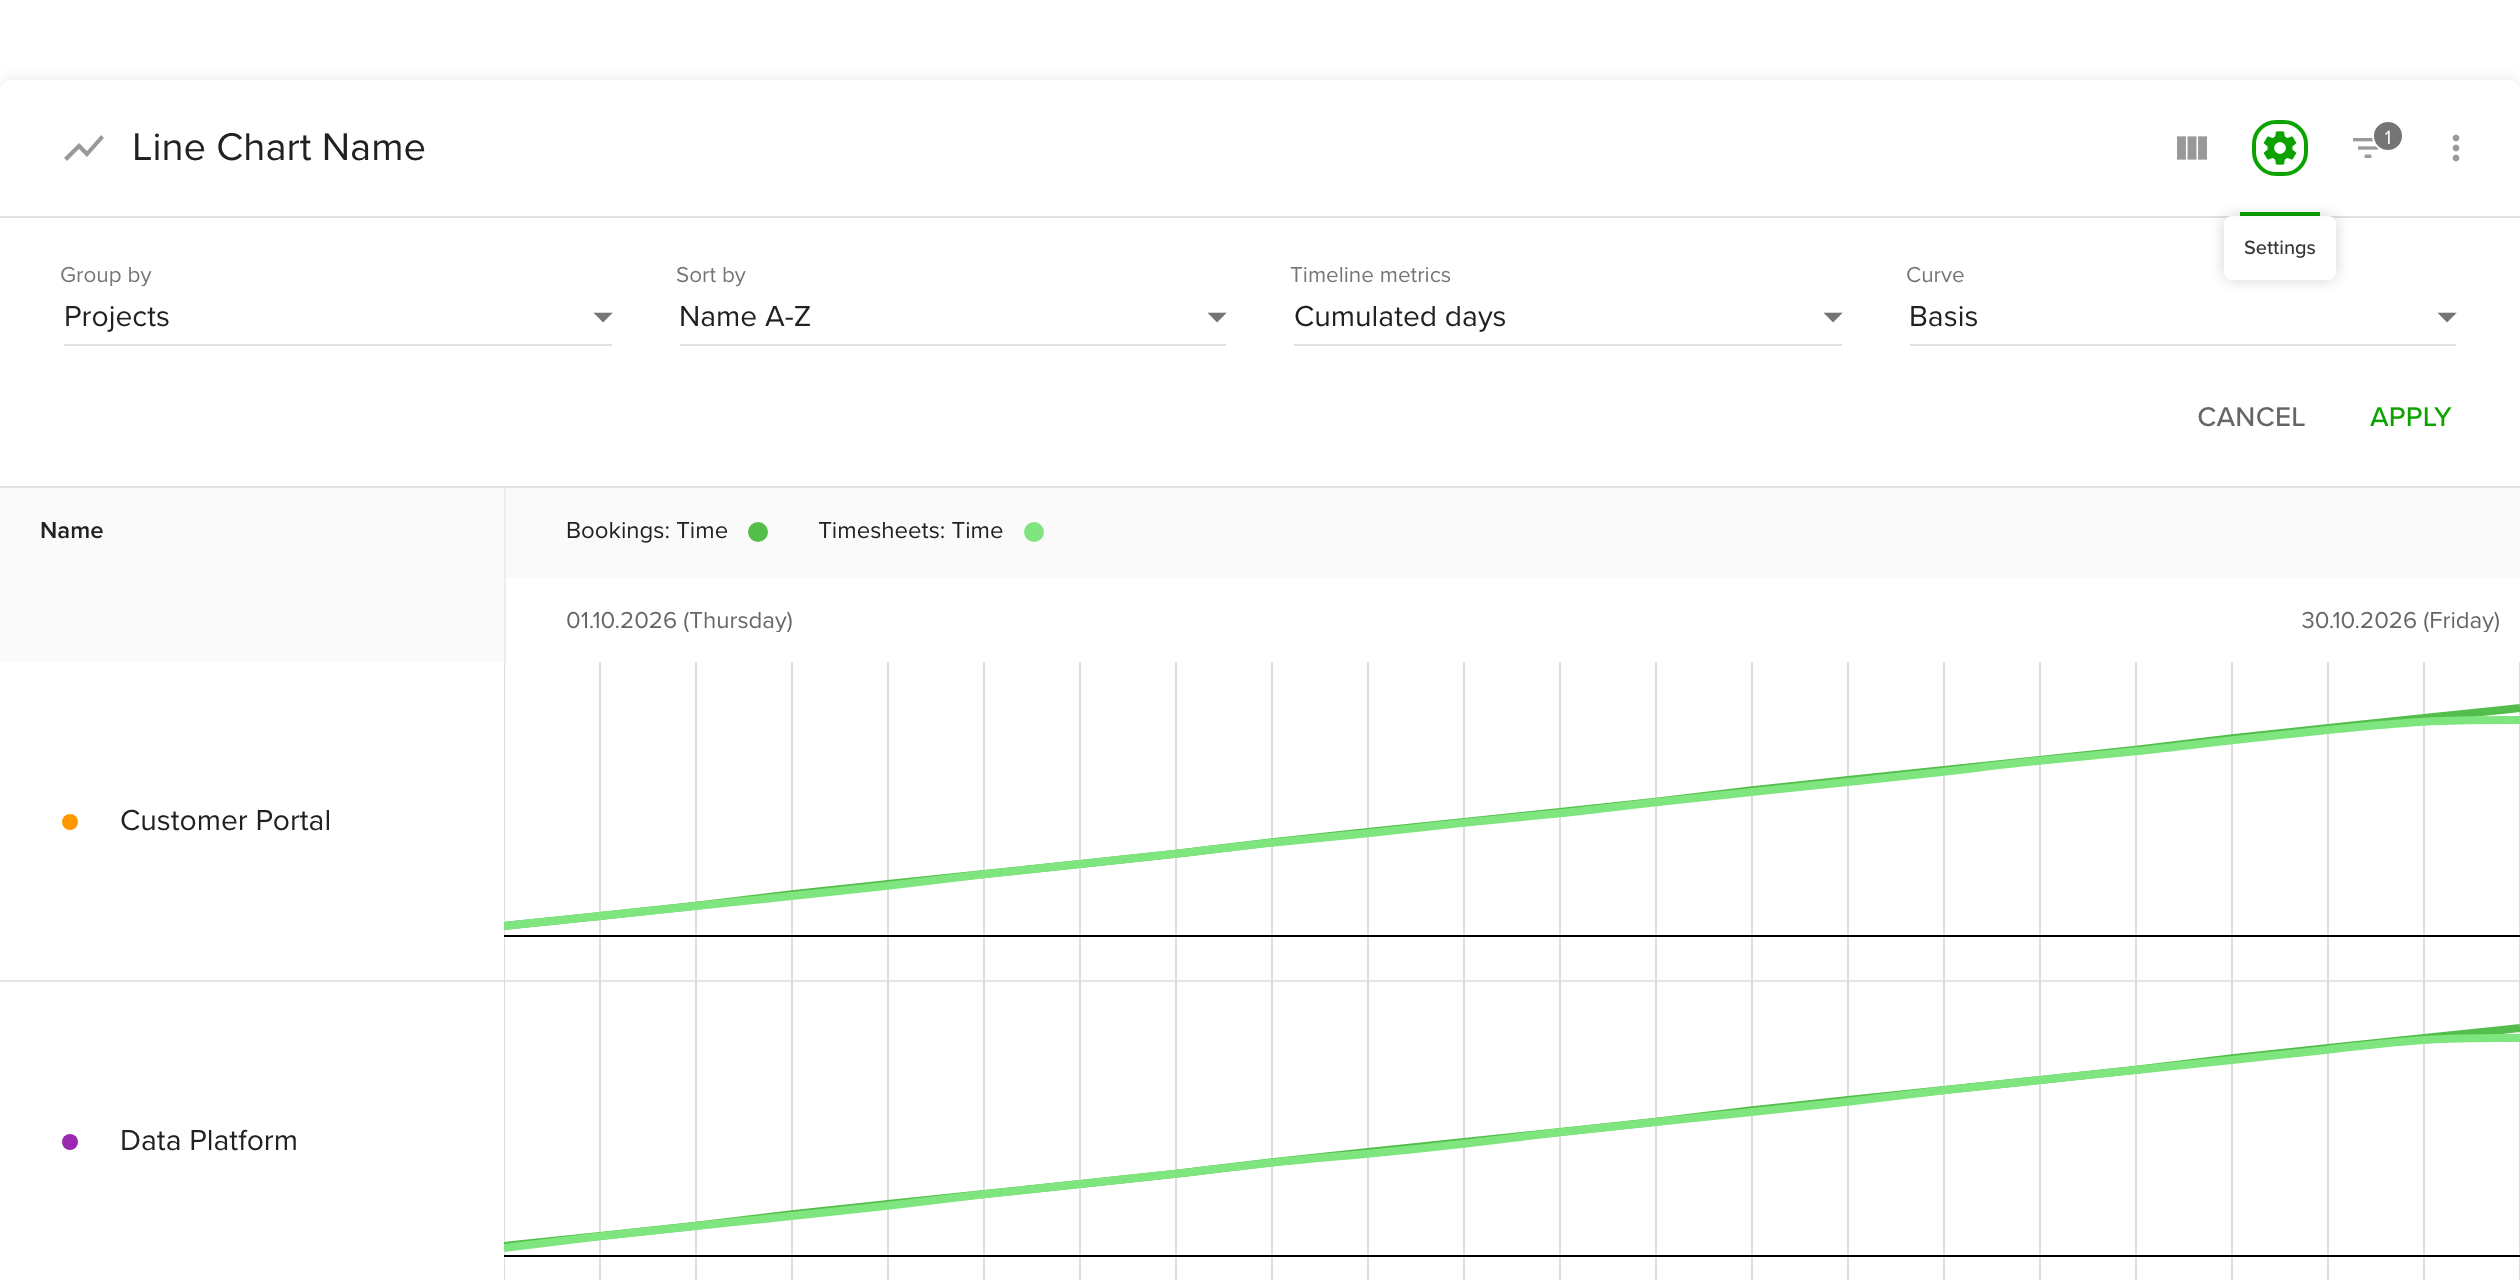
- Group by sets the category the chart is split by.
- Sort by orders the data, for example by name from A to Z.
- Timeline metrics sets how the time axis is shown, for example per day or as a cumulated total. Cumulated values show how a number grows over time, which helps you watch billable hours against a budget.
- Curve sets the shape of the line.
Bar chart
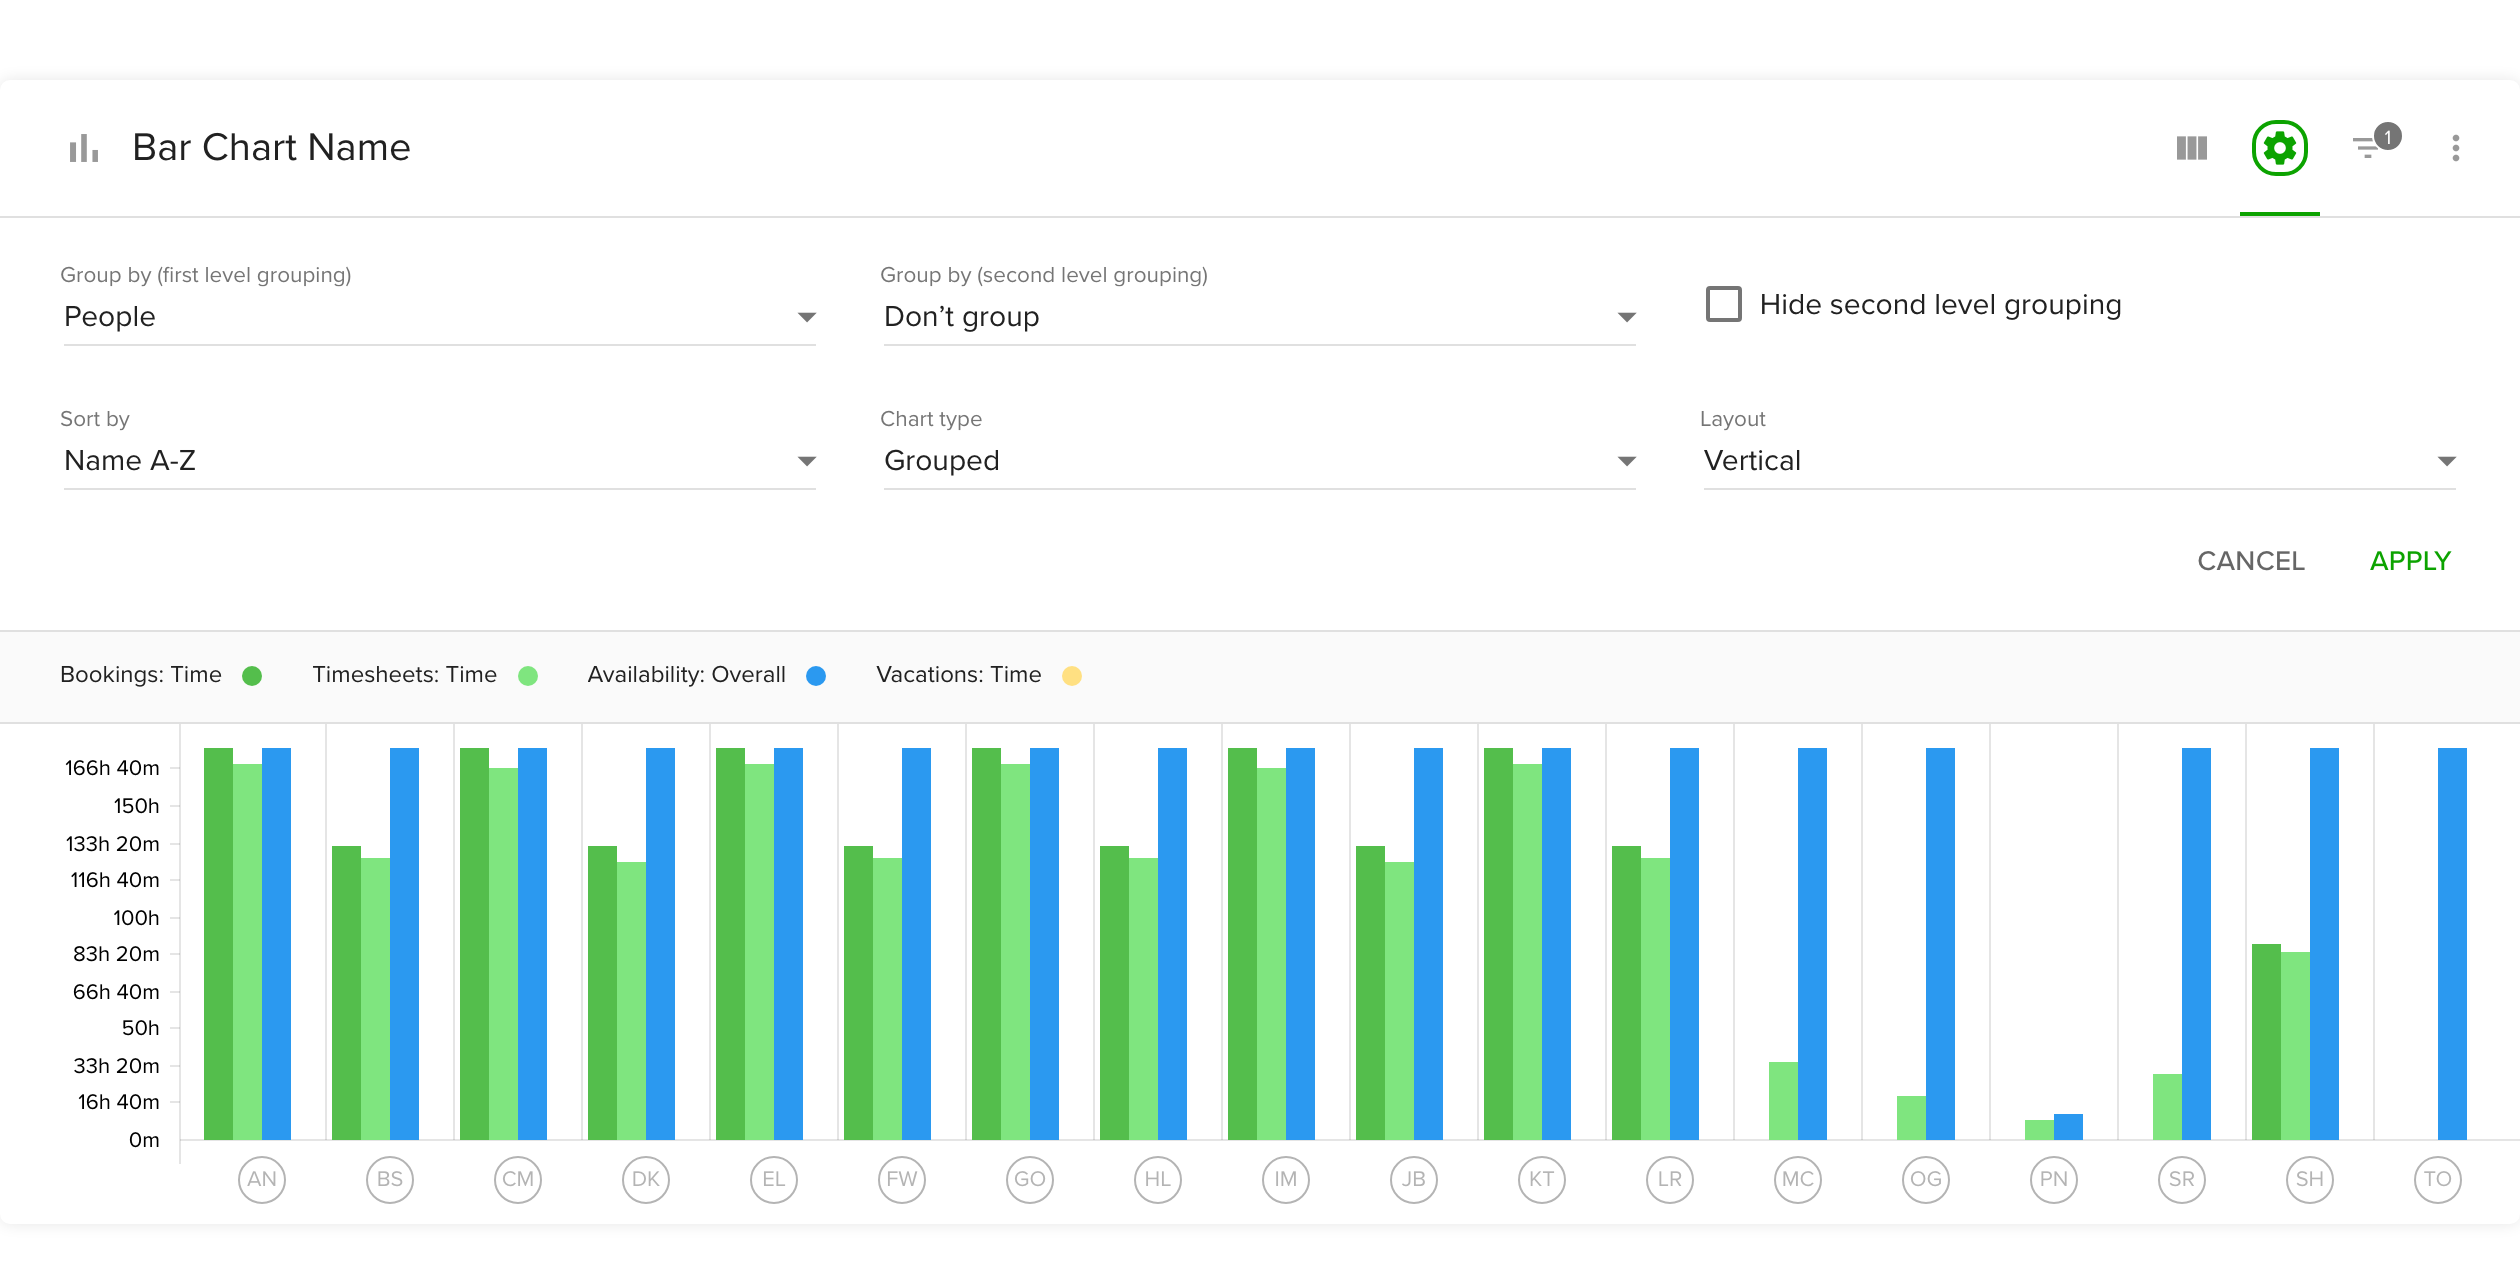
- Group by (first level grouping) is the main category, such as projects.
- Group by (second level grouping) splits each bar further, for example by people. Tick Hide second level grouping to hide it.
- Sort by orders the bars.
- Chart type places bars side by side (grouped) or on top of each other (stacked).
- Layout sets vertical or horizontal bars.
Pie chart
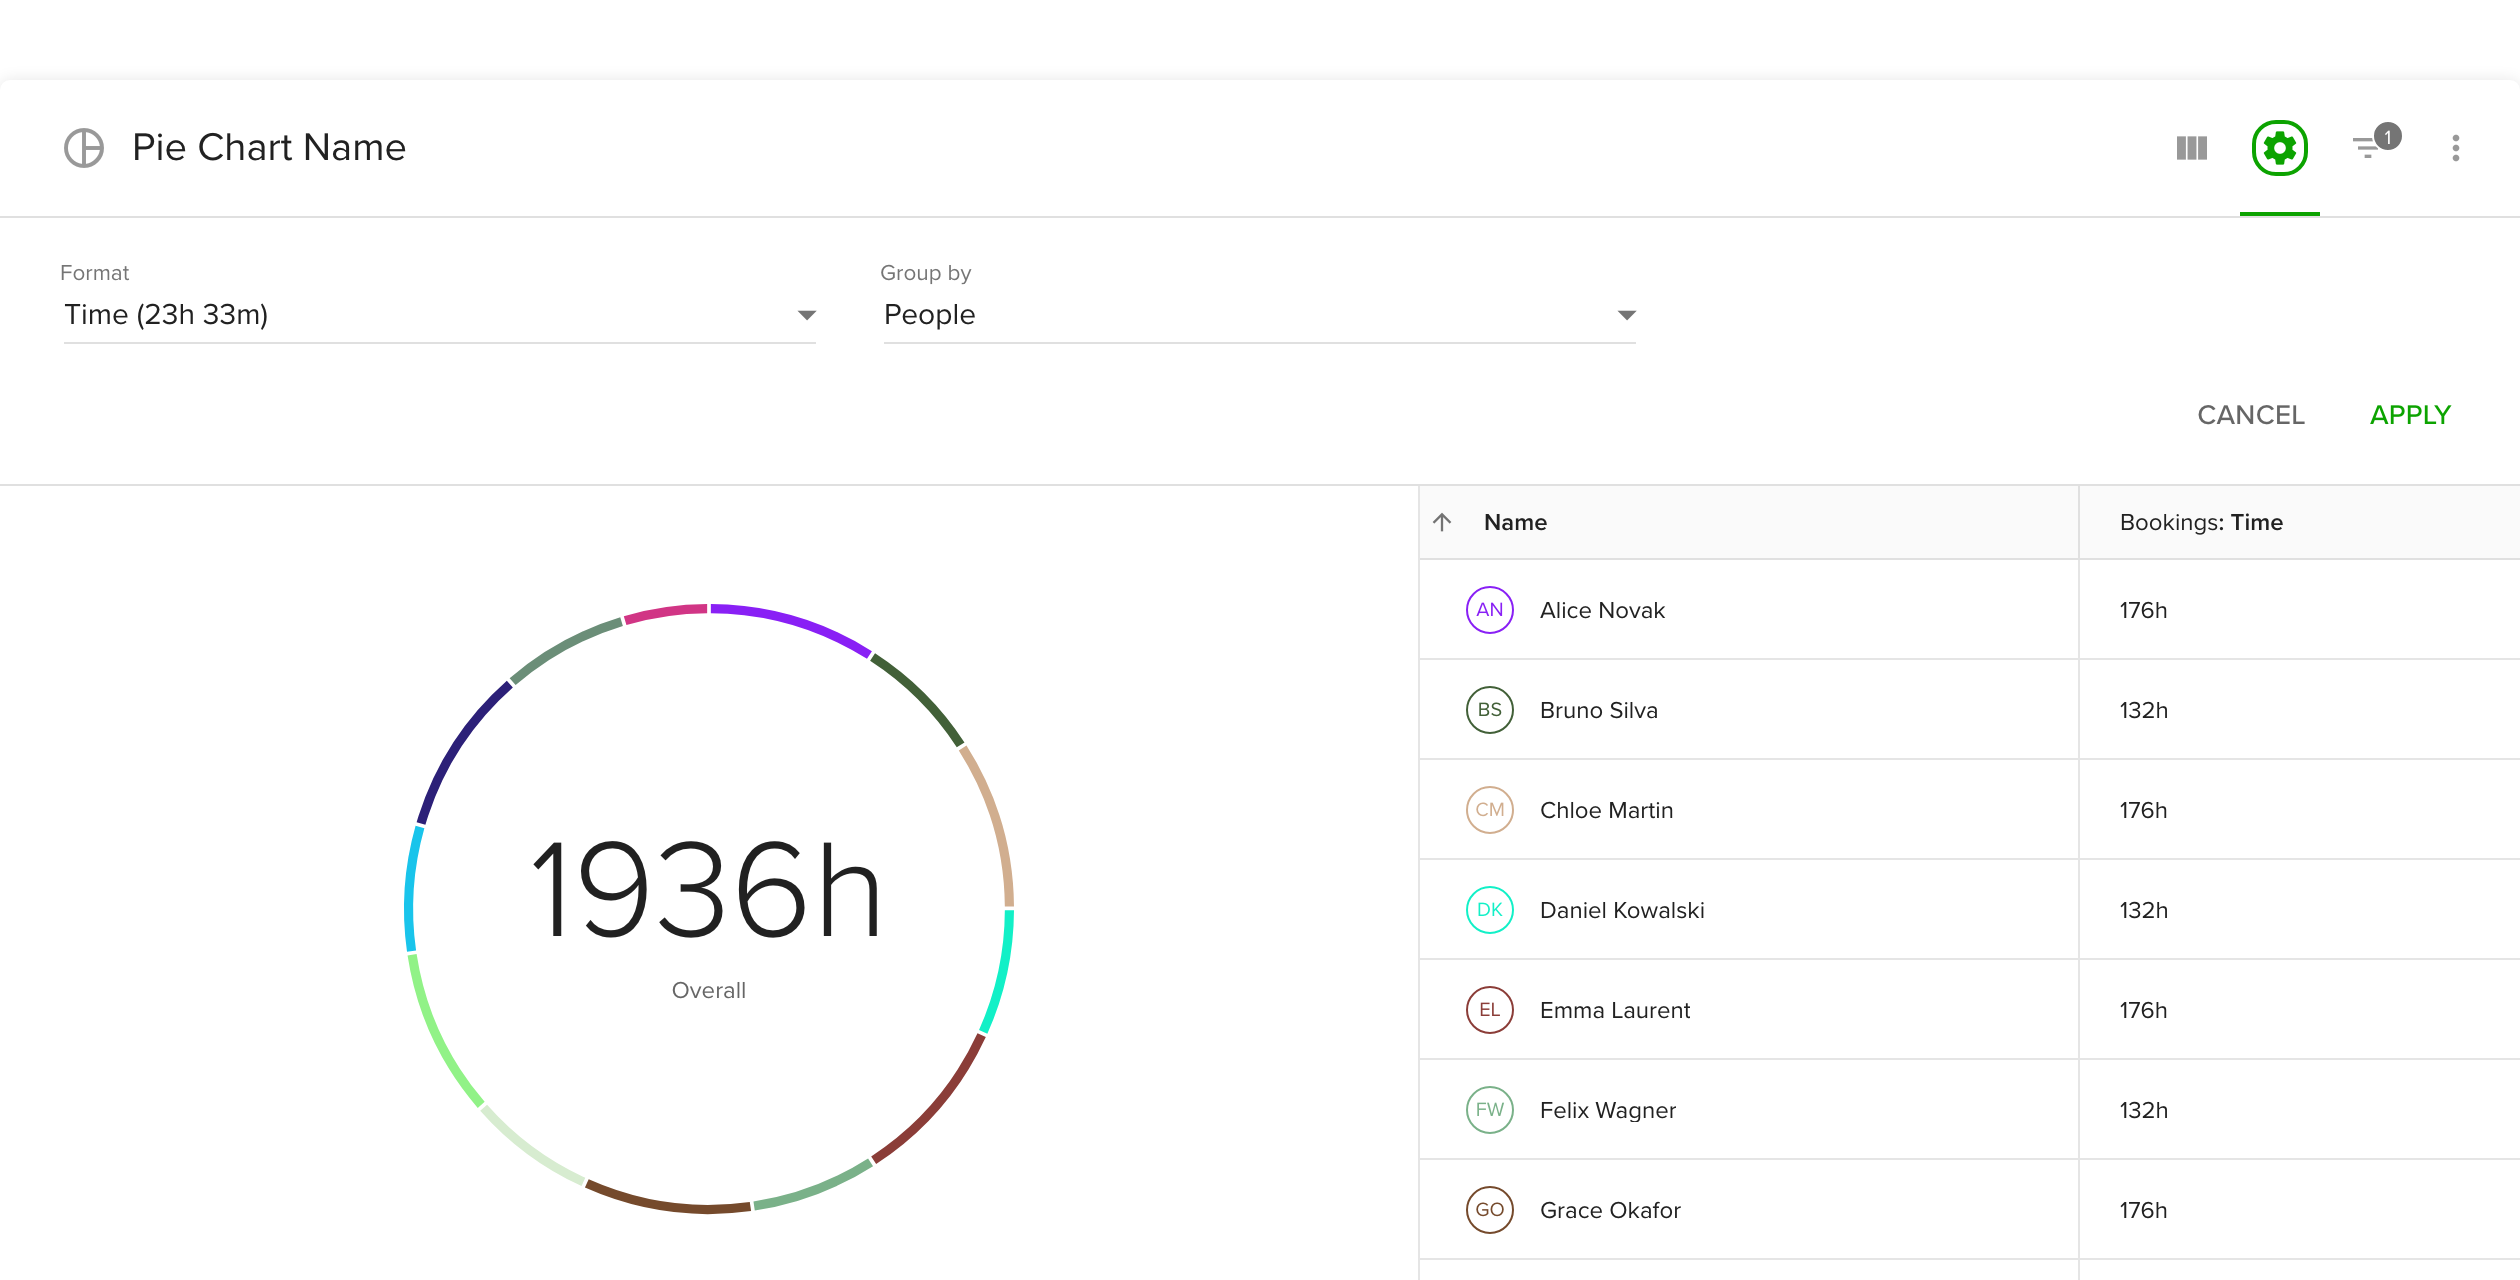
- Format sets how values are shown, for example as time.
- Group by sets the slices. To see time spent per project, choose a timesheet time metric with the metrics button and group by projects.
Move, copy or delete a section
Click the three-dot menu of a section and pick Move up, Move down, Export, Create copy or Delete. See Export reports and data for Export.
When you finish, click Save at the top of the report.
Tips
- Add a custom values column for hourly rates first, then a calculation field that multiplies them by tracked time.
- Use tag filters to separate billable and non-billable hours.
- For an overview of payroll, see the payroll calculation guide.
Troubleshooting
- A custom values column is missing from the formula picker. Columns with the text format cannot be used in formulas. Create it again with a number format.
- The chart shows no data. Check the date range and the filters, and make sure at least one metric is ticked.