

Use functions to create custom calculations
Combine report metrics with built-in functions to calculate profit, overtime, averages and counts.
On this page
Custom calculations add your own numbers to a report: a profit column, an overtime flag, an average per project. You write a formula that combines Teamdeck metrics, such as booked or tracked time, with built-in functions.
Before you start
- You need a report with a table or chart. See Create, save and share reports.
- If your formula needs numbers Teamdeck does not have, such as an hourly rate, add a custom values column first and fill it in. See Customize your reports.
Add a custom calculation
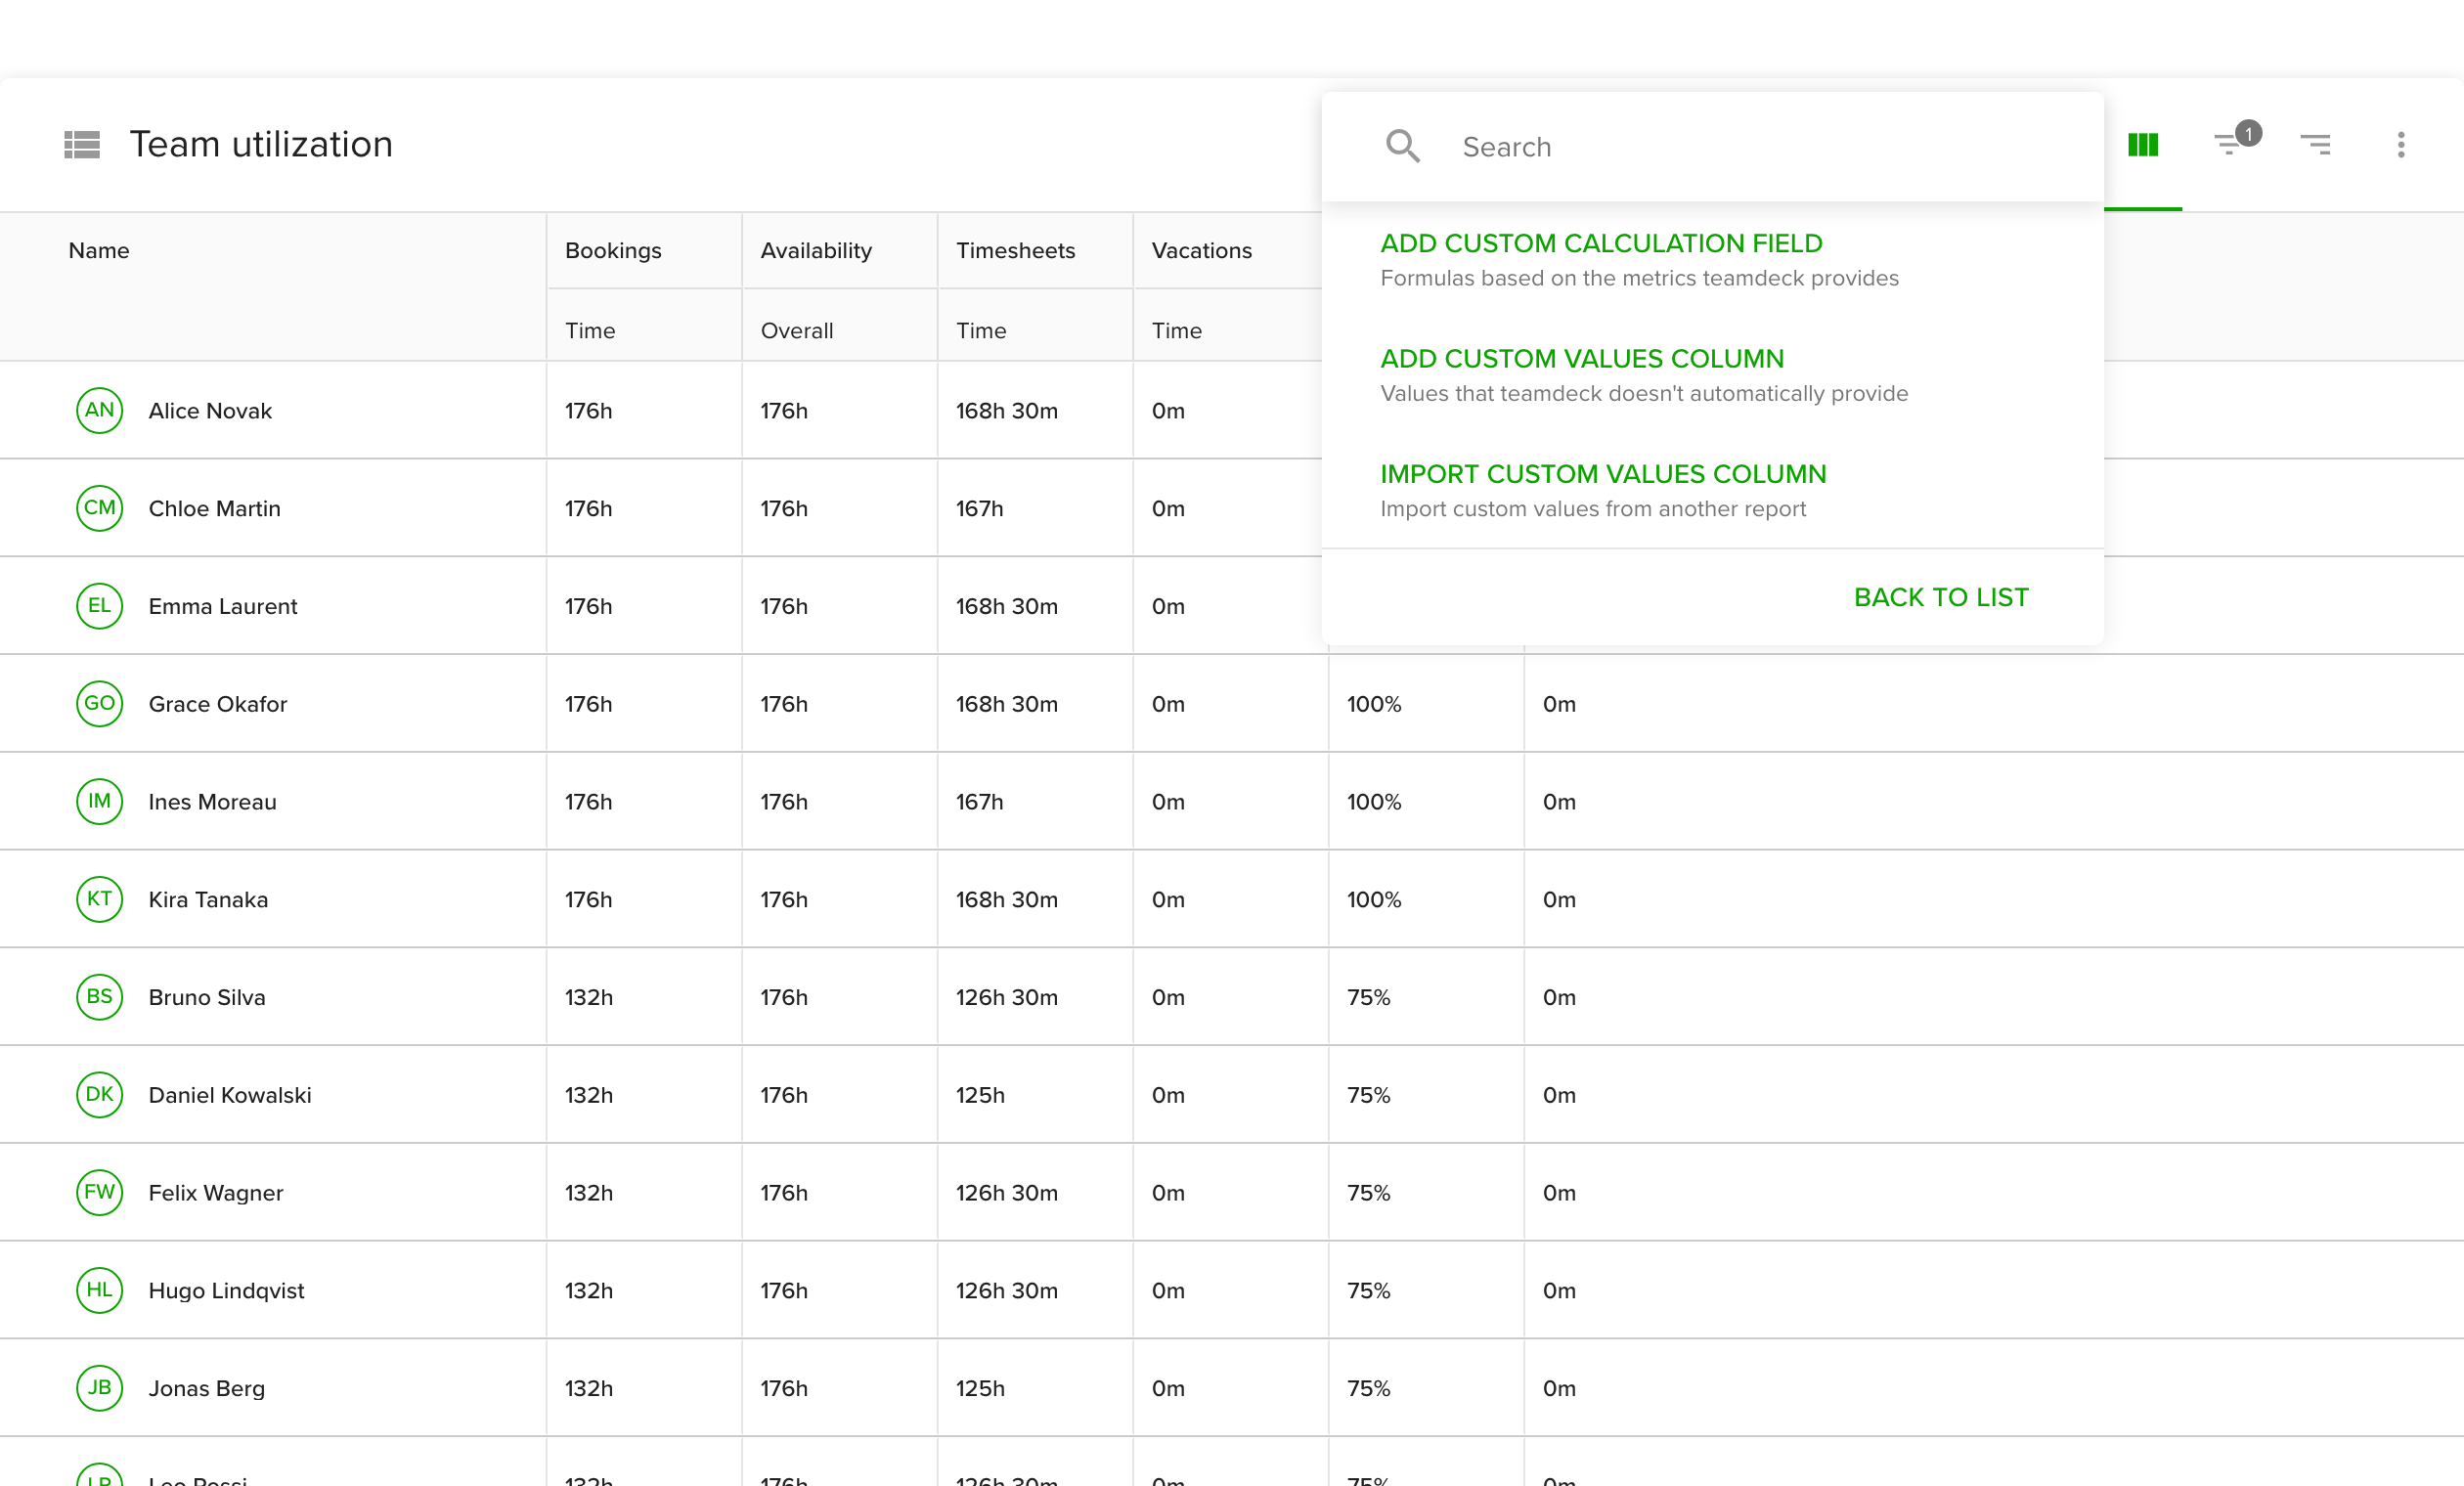
- Click the columns icon in the top right of the table or chart.
- Click Add custom and choose Add custom calculation field.
- Enter a Calculation name and pick a Data format. Choose a currency for money, or time for hours.
- Write the formula in Type formula. You can use metrics from the report and custom values as inputs.
- Click Save and apply. The calculation appears as a new column or data series.
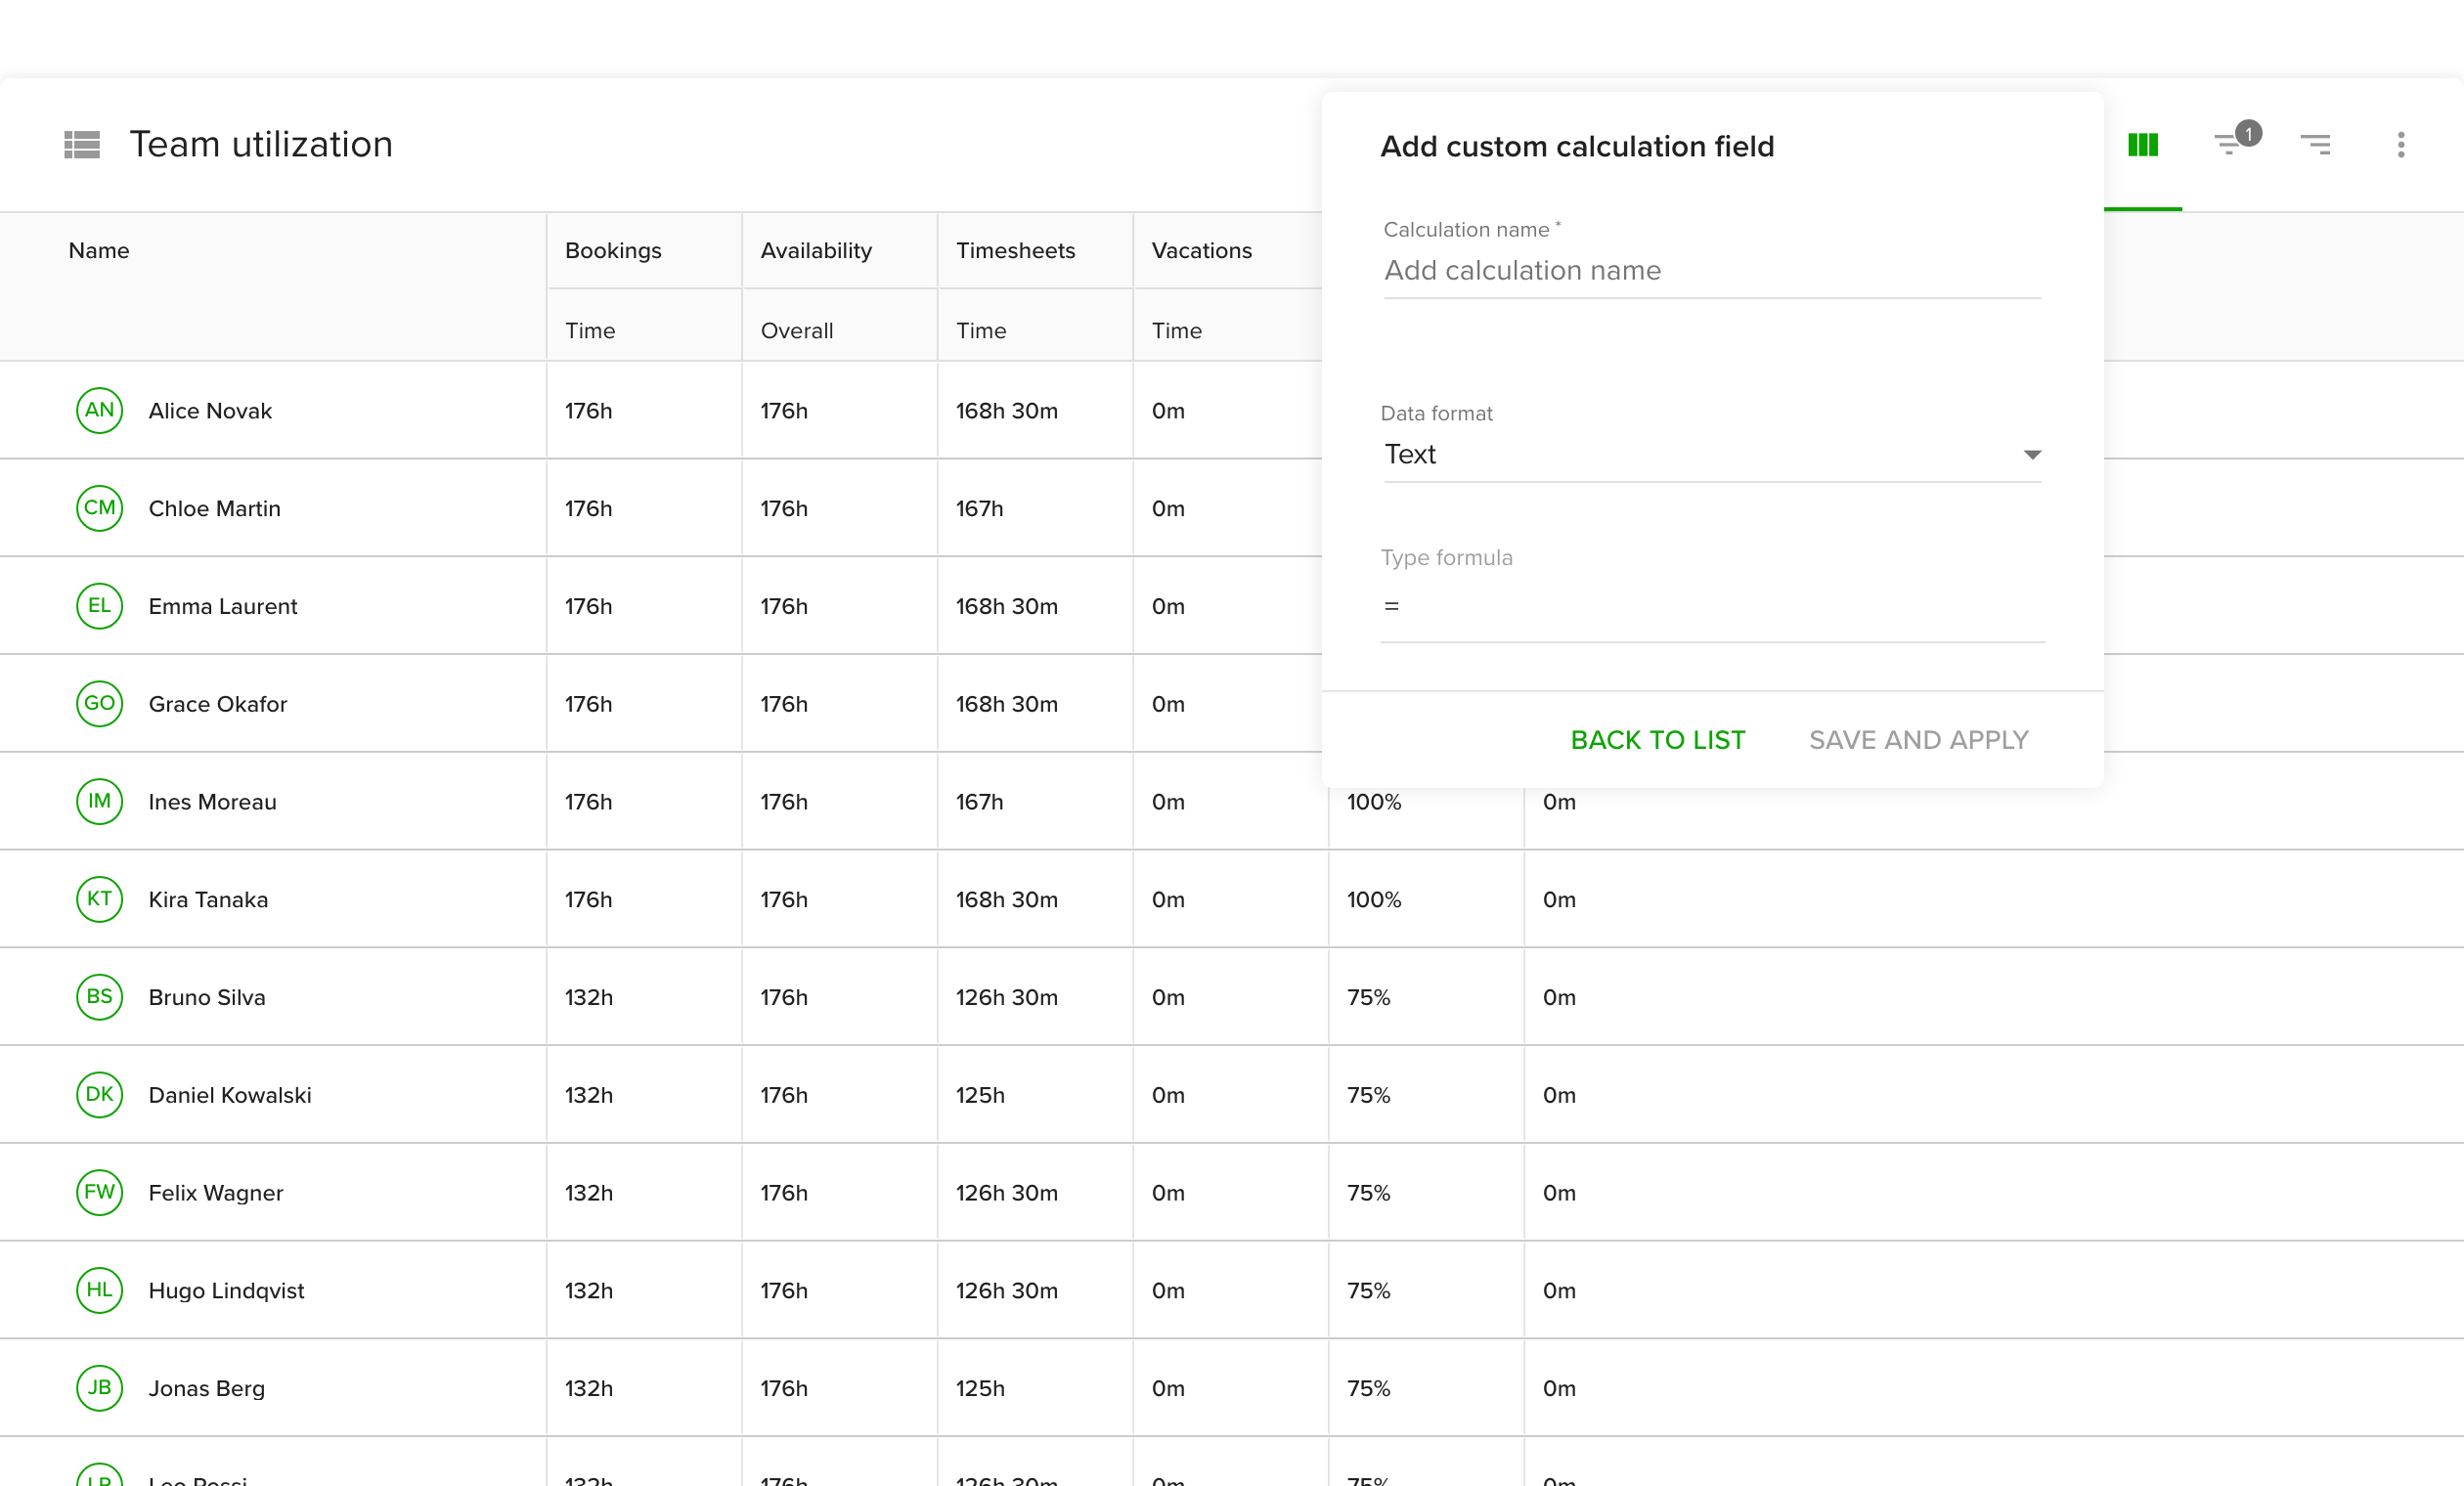
A column with the text format cannot be used inside a formula. Pick the data format that matches what the formula returns, for example time when you look for the highest time value.
Math functions
abs(x): the absolute (non-negative) value.add(x, y): adds values.x + ydoes the same.subtract(x, y),multiply(x, y),divide(x, y): the same asx - y,x * yandx / y.pow(x, y): x to the power of y.square(x)is x times x.mod(x, y): the remainder of x divided by y. For examplemod(8, 3)returns 2.round(x)andround(x, n): round to the nearest whole number, or to n decimals.ceil(x),floor(x),fix(x): round up, round down, and round toward zero.
Comparison and logic functions
These return 1 when the condition is true and 0 when it is not, so choose the whole number format for the result.
compare(x, y): returns 1 when x is larger, -1 when it is smaller and 0 when they are equal.equal(x, y),larger(x, y),largerEq(x, y),smaller(x, y),smallerEq(x, y): compare two values.and(x, y),or(x, y),xor(x, y),not(x): logical operators.string(x): converts a value to text.
Statistics functions
Pick a data format that matches the metrics you analyze.
max(a, b, c, ...),min(a, b, c, ...): the highest and lowest value.sum(a, b, c, ...): the total.median(a, b, c, ...): the middle value, which outliers affect less than the average.average(array, [ignoreEmpty]): the mean. SetignoreEmptytotrueto skip 0 values.
Functions for groups and rows
These work with the grouping of your table. Say a table is grouped by projects, then people, then weeks.
get(group, metric): all values of a metric for one level, across the whole table.nested(group, metric): the values nested below the current row.ancestor(group, metric): the value of a metric on a higher level of the current row.total(metric): the total of a metric, also for metrics not shown as columns.count(array): the number of rows.countif(array, condition): the number of rows that meet a condition.sumif(array, condition, expression): the sum of values that meet a condition.if(expression, valueIfTrue, valueIfFalse): returns one value or another. The results can be numbers, text or currency.name(): the name in the first column of the current row. Combine it withifto treat specific rows differently.isEmpty(metric): checks whether a metric has a value. It is useful for custom values columns and custom fields.isGroup(group): checks whether the current row belongs to the given group.indexOf(metric, phrase): the first position of a phrase in a text value.
Examples
Average tracked time per person, across all projects:
average(get(Group: People, Timesheets: Time))
The same average calculated separately for each project, because people are nested under projects:
average(nested(Group: People, Timesheets: Time))
Flag people who tracked more than 8 hours:
if(Timesheets: Time > 480, "overtime", "ok")
Count the people on each project who tracked any time:
countif(nested(group: People), Timesheets: Time > 0)
The report templates are built the same way. Utilization, for example, divides Bookings: Time by Availability: Overall and multiplies by 100.
Tips
- Build the calculation in small steps. Add a custom values column for the hourly rate, test a formula for cost, then build profit from it.
- Name calculations after what they show, such as "Profit per project", so colleagues understand the report.
- Use
nestedinstead ofgetwhen you want a separate result per group.
Troubleshooting
- The formula does not accept a column. Columns with the text format cannot be used in formulas.
- The result shows the wrong unit. Change the data format of the calculation to match the result, for example time or currency.