Companies that run one or multiple projects at a time, like agencies or software houses, need to make sure that their scheduling efforts are effective. One way to do that is to measure the billable utilization rate. In this blog post, we’ll show you how to calculate utilization using a robust resource management software — Teamdeck. But first, let’s explain why tracking this metric may be beneficial for your business in the first place.

What will you get with this article:

  • The understanding of the difference between billable and non-billable time
  • Well-described difference between resource utilization rate and billable utilization rate
  • The reasons for tracking billable utilization rates
  • How does resource management software help with billable utilization

Billable vs. non-billable time

When you bill your clients by the hours using the “time and materials” model, you know that not all of your team’s working hours count towards the overall bill. Billable hours usually include the time your employees spent on billable activities: e.g., developing software for the clients or writing copy for their campaign. However, you also have to account for the non-billable work, which usually involves training sessions, drafting client proposals, working on internal projects, etc.

Sure, non-billable work may be necessary to keep your business up and running. Still, you should keep an eye on the number of and calculate billable hours and the non-billable ones as well to make sure your company stays profitable. If the ratio is upset, you may start to lose money—after all, you still have to pay your employees and cover operational costs.

What’s the difference between resource utilization rate and billable utilization rate?

You might be wondering whether you should start tracking billable utilization if you’re already monitoring the overall employee utilization.

See, when you calculate resource utilization, you usually compare the number of hours someone worked for vs. their overall capacity. It tells you a lot: you can spot overworked team members or identify underutilized people. However, as you know already, not all hours are created equal. Just because someone is busy doesn’t necessarily mean that their work directly contributes to your company’s profits. On the other hand, when you track billable utilization, you can see what’s the proportion of everyone’s availability that’s being spent on billable activities.

It isn’t to say that everyone’s billable utilization should be as high as possible. After all, there likely are people at your company that doesn’t work on client projects at all. For them, you can rely on the overall utilization to make sure their workload is balanced. However, when it comes to team members contributing to client work, their billable utilization rate can give you valuable insights.

Why should you track billable utilization rates?

First and foremost, tracking utilization rates enables you to evaluate scheduling in project management. If someone who should be primarily working on billable tasks has a utilization rate of 20%, it may indicate that their schedule wasn’t planned optimally. Perhaps the project estimates weren’t accurate, and this particular employee simply doesn’t need all of that allotted time to do their job. Maybe, they participate in too many potentially unnecessary meetings. Either way—there’s room for some optimization.

Imagine a different situation: say that an employee’s billable utilization rate is at 110%. It means that they spend more time working than their capacity would allow for. It’s not uncommon for a project to require putting in some extra hours just before the deadline. Still, if you don’t spot an overworked employee in time, you may risk them getting frustrated or even deciding to leave your company.

Finally, calculating billable utilization is an excellent way to assess which roles are in high demand and when. Such insights make it possible to accurately forecast human resources and time hiring processes correctly.

Calculate billable utilization using Teamdeck

You may have already guessed it, but to gather reliable resource utilization data, your team should be using a time tracking tool. Without it, you’re dealing with guesstimates rather than accurate information. Of course, there are even more benefits of agency time tracking software, so if you haven’t already, definitely give it a try!

Your team’s timesheets will provide you with information about how much time was spent on different projects. However, to take only billable work into account, you need a tool that allows your employees to mark their recorded time entries as either billable or non-billable.

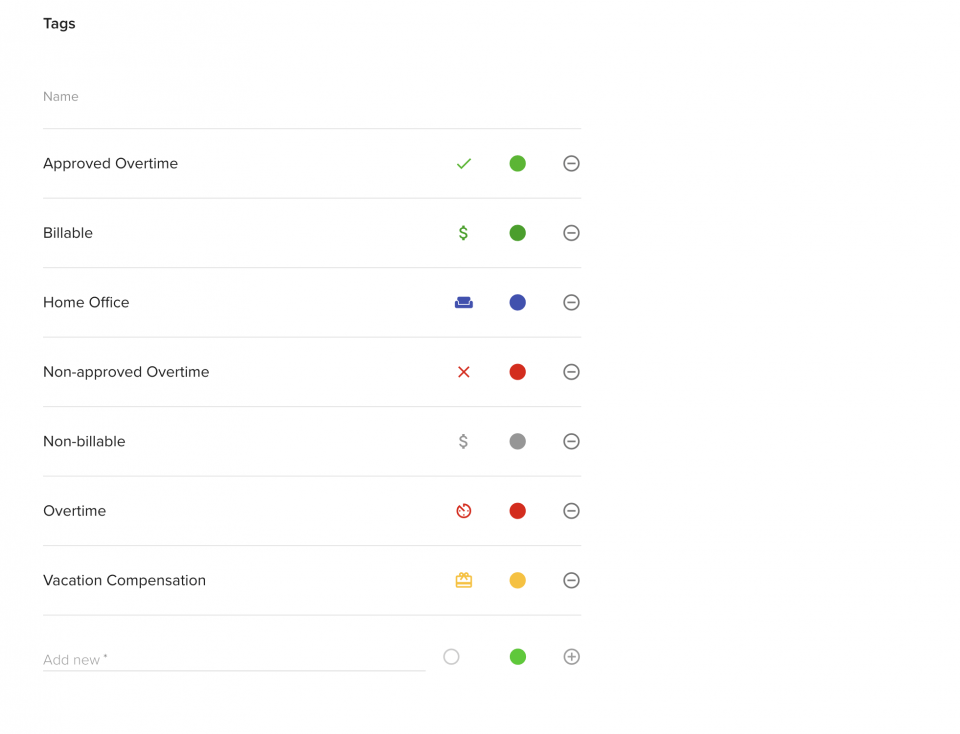
Teamdeck allows your team members to make such a distinction. They can use the so-called timesheet tags to mark their time entries as “billable”, “overtime”, “working from home”, etc. The tags are up to you—you can choose custom labels and icons that work for your needs.

Timesheet tags

When your team tracks their time with Teamdeck and uses timesheet tags, you can easily create a billable utilization report.
Head to the reports section in the top menu, then click on the plus icon in the bottom right corner to add a new report. Pick “create custom”—we’ll be creating a report from scratch, not based on a template.

Give your title a name and select the appropriate date range. It’s now time to start adding charts and tables to your report. Let’s start with a simple bar chart that will show us billable time spent per team member. Click “add graph” and “add bar chart”. By default, you will see a comparison of everyone’s bookings, timesheets, vacation hours, and availability. Click on “metrics” (it’s the icon with three columns) and uncheck the unnecessary metrics. Instead, scroll down to the “Timesheet tags” category and select “Billable”.

This simple chart lets you see how many billable hours each person recorded. However, it doesn’t give you much context as to what was the billable utilization rate. Let’s add another metric to this graph—”Timesheets: time”. Now you can at a glance see what the proportion of billable hours to all hours tracked by a given person was.

Now, let’s add a table to your report that will enable us to calculate billable utilization rates for all employees.

By default, a new table added to the report is organized by projects. You can change that setting by clicking on “grouping” and swapping people with projects in the drag and drop editor. If you don’t need to see the data broken down by days, you can safely remove it from the grouping. Click “apply” to save this grouping.

While you’re at it, go to metrics and uncheck the unnecessary columns (bookings, availability, vacations). Our suggestion is to add a column for timesheet tags: billable. Currently, your table should look like this:

It’s basically the same information you had in the bar chart we’ve previously created. It would be great to add the utilization rate expressed as a percentage value to the table. You can do that by clicking on “metrics”, then “add custom”, and then “add custom calculation field”. Billable utilization isn’t a metric calculated by default in Teamdeck as not every organization uses timesheet tags, but we can type in a utilization formula and create a custom metric.

The utilization formula goes as follows:
(Billable hours/All timesheets)*100

Click “save and apply” – you’ll see a new column appear in your report. Here you can see your employees’ utilization rates.

In our case, there are a couple of team members that have very high billable utilization. It’s clear that most of their hours go to client work. On the other hand, we also have some resources whose utilization rate is 0%. It might be the case that their job doesn’t concern billable services, so we shouldn’t expect them to log billable hours.

One last thing we can do to make the whole report even more insightful is to change the formula in the “total” row of the table. Currently, it’s the sum of values in all rows. While it’s useful for the first two columns, it’s not really telling us much about the “Billable utilization” column. An average value would be much better. Luckily, we can easily calculate it. Click on this cell and type:

= average(nested(Group: People, Custom formulas: Billable utilization))

Note that Teamdeck will give you suggestions as you start typing variables’ names. Click enter to see the result. Now we know that the average billable utilization rate for our team is 53.05%

Make your organization more data-driven!

Monitoring your team’s performance is a great opportunity to spot areas that could be optimized for your organization’s benefit. Your employees will also appreciate you keeping an eye on their utilization—after all, they don’t want to be overworked.

If you feel like Teamdeck could be a helpful tool for your team, definitely give it a try. You can sign up for a test drive yourself or schedule a call with Aniela, our customer success expert. We’re happy to help you make the most of this app and significantly improve your company’s project and resource management processes.

Looking for software that helps with billable utilization?

Try our Teamdeck resource planning software

Related posts

Project calendar to manage project schedule tasks and manage resources
项目管理

Resource Calendar – Manage Your Whole Team in 1 Tool

Resource calendar (or project management calendar, or project planning calendar, resource planning software) allows you to plan and manage and allocate resources more effectively and efficiently – especially if Microsoft Excel had a leading role in your...

Allocate resources and manage project planning with capacity planning tools>
项目管理

Resource Capacity Planning in Project Management

What’s the ultimate goal of project managers? Delivering their projects successfully. PMs themselves admit that this doesn’t happen very often: according to the latest Pulse of the Profession survey, less than 60% of projects are completed either...