We’ve just rolled out a new reports module, so that you can get better insights into your company’s resources and projects they are assigned to. Based on this information you’re able to optimize resource allocation and plan future projects with better accuracy. Calculate the ROI of your projects, monitor the burn rate and measure your team’s utilization.

Here’s what’s new:

Visualize your data

First, we’ve changed the way you can display the data. There are now several types of charts:

resource management reports
team utilization report

You can use multiple graphs and tables in your report, depending on what best illustrates a given dataset. This leads to the next improvement – report customization.

Customize your reports

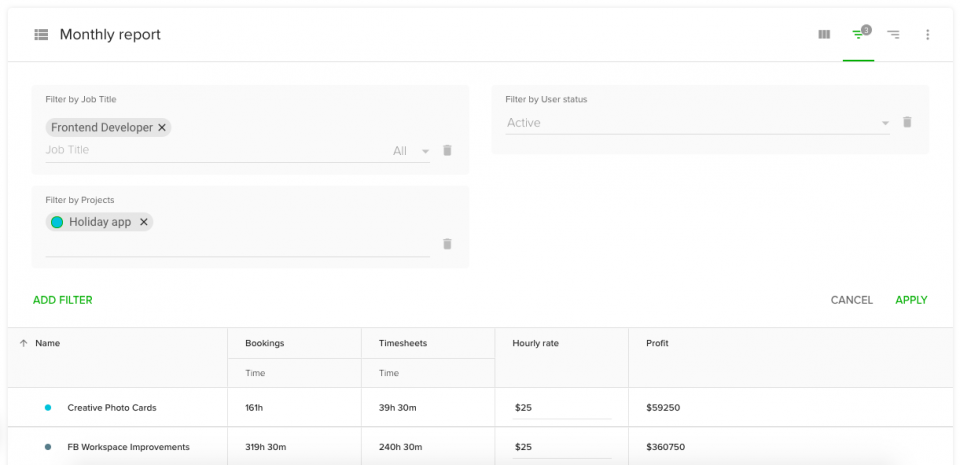
We want teamdeck to fully answer your needs, that’s why we made the reports customizable. You can combine tables and charts to make your report more specific and relevant to what you want to analyze.

Compare bookings, timesheets, vacations and availability. Pick the metrics and hit apply to analyze only what’s the most important for you at the moment.

Now, to drill down your data even more, group it by projects, people and date range to compare different data sets. This way you can evaluate specific projects or people. Is your report still too broad? Add filters like job title, project’s name, vacations reason or tags.

reports filters

You can also assign monetary value to the hours logged in your company’s timesheets:

custom values reports

Perform custom calculations

A feature we’re really excited about are custom calculations. They are formulas used to compare different variables available within the app (employee’s availability, bookings, timesheets or number of days off) along with the custom values you’ve added to your dashboard (hourly rates, vacation allowance etc.).

You can use them to compare total company costs within a given timeframe or the number of employees and company revenue, to calculate metrics like cost of workforce or employee productivity rate.

custom formula reports

Share your reports

Whether you want to show your team’s timesheets to the client or share the latest KPIs with the stakeholders, you can give others access to your reports.

External parties and regular team members can view the report, while people with manager and owner accounts can have either viewing or editing permissions.

Start within seconds

In order to bring you up to speed with the new reports, we’ve prepared a couple of actionable templates. Head to the app and use one of these templates in order to measure your KPIs or generate your team’s next payroll.

What do you think about this product update? Let us know if you like it or if there’re still features you miss in our tool. Your feedback means a lot to us!

We’ve also prepared a couple of guides for data-driven project managers:
Calculate employee payroll
Track project budgets

Get to know why Hill-Knowlton, Wunderman Thompson, or Unit9 have chosen our resource planning software

Related posts

price change
teamdeck

Announcing our 2024 Vision & Updates to Teamdeck product & pricing

Dear Teamdeck Community,As we journey together through the dynamic world of project management and resource scheduling, our commitment to providing a transparent, value-driven service remains unwavering. We’ve consistently aimed to offer our core services competitively, with the...

Project profitability in project management
teamdeck, Toolbox

Track Project Profitability with Teamdeck

Keeping track of projects’ profitability is essential for agencies, software companies, or consultancies of any kind. When you work with multiple clients on delivering multiple projects, you simply have to make sure that your efforts generate profits....